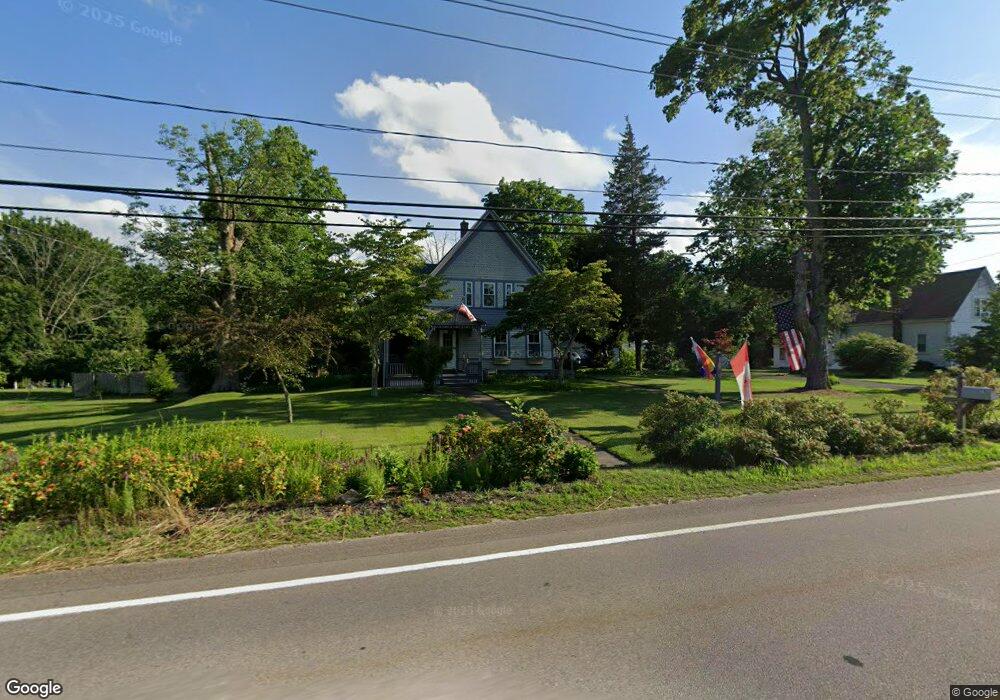
195 Main St Hanson, MA 02341
Estimated Value: $531,000 - $849,000
5
Beds
2
Baths
3,000
Sq Ft
$228/Sq Ft
Est. Value
About This Home
This home is located at 195 Main St, Hanson, MA 02341 and is currently estimated at $682,931, approximately $227 per square foot. 195 Main St is a home located in Plymouth County.
Ownership History
Date
Name
Owned For
Owner Type
Purchase Details
Closed on
Nov 10, 2006
Sold by
Waddell Christopher L
Bought by
Waddell Christopher L and Waddell Heidi L
Current Estimated Value
Home Financials for this Owner
Home Financials are based on the most recent Mortgage that was taken out on this home.
Original Mortgage
$272,000
Interest Rate
6.31%
Mortgage Type
Purchase Money Mortgage
Purchase Details
Closed on
Apr 1, 1996
Sold by
Saluti Hugo F and Saluti June D
Bought by
Childs Thomas B and Childs Heidi S
Purchase Details
Closed on
May 13, 1987
Sold by
Raftery Michael
Bought by
Saluti Hugo F
Create a Home Valuation Report for This Property
The Home Valuation Report is an in-depth analysis detailing your home's value as well as a comparison with similar homes in the area
Home Values in the Area
Average Home Value in this Area
Purchase History
| Date | Buyer | Sale Price | Title Company |
|---|---|---|---|
| Waddell Christopher L | -- | -- | |
| Childs Thomas B | $154,500 | -- | |
| Saluti Hugo F | $182,000 | -- |
Source: Public Records
Mortgage History
| Date | Status | Borrower | Loan Amount |
|---|---|---|---|
| Open | Saluti Hugo F | $252,800 | |
| Closed | Saluti Hugo F | $272,000 |
Source: Public Records
Tax History Compared to Growth
Tax History
| Year | Tax Paid | Tax Assessment Tax Assessment Total Assessment is a certain percentage of the fair market value that is determined by local assessors to be the total taxable value of land and additions on the property. | Land | Improvement |
|---|---|---|---|---|
| 2025 | $5,725 | $427,900 | $169,700 | $258,200 |
| 2024 | $5,559 | $415,500 | $164,800 | $250,700 |
| 2023 | $4,891 | $344,900 | $164,800 | $180,100 |
| 2022 | $4,785 | $317,100 | $149,800 | $167,300 |
| 2021 | $4,373 | $289,600 | $144,000 | $145,600 |
| 2020 | $4,134 | $270,700 | $139,100 | $131,600 |
| 2019 | $59 | $259,200 | $136,500 | $122,700 |
| 2018 | $3,986 | $251,800 | $131,300 | $120,500 |
| 2017 | $3,870 | $242,200 | $125,000 | $117,200 |
| 2016 | $3,959 | $239,200 | $125,000 | $114,200 |
| 2015 | $3,775 | $237,100 | $125,000 | $112,100 |
Source: Public Records
Map
Nearby Homes