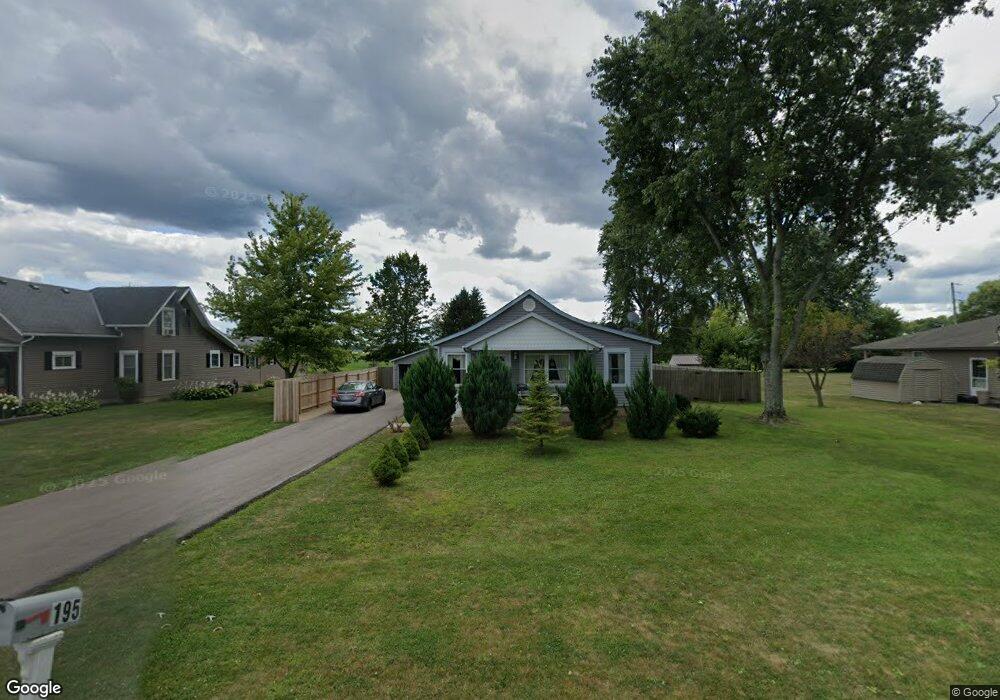
195 Marion Cardington Rd E Marion, OH 43302
Estimated Value: $138,000 - $233,000
2
Beds
1
Bath
1,116
Sq Ft
$163/Sq Ft
Est. Value
About This Home
This home is located at 195 Marion Cardington Rd E, Marion, OH 43302 and is currently estimated at $181,700, approximately $162 per square foot. 195 Marion Cardington Rd E is a home located in Marion County with nearby schools including Pleasant Elementary School, Pleasant Middle School, and Pleasant High School.
Ownership History
Date
Name
Owned For
Owner Type
Purchase Details
Closed on
Aug 18, 2022
Sold by
Mitchell Wanda L
Bought by
Mitchell Paul
Current Estimated Value
Home Financials for this Owner
Home Financials are based on the most recent Mortgage that was taken out on this home.
Original Mortgage
$100,000
Outstanding Balance
$95,443
Interest Rate
5.3%
Mortgage Type
New Conventional
Estimated Equity
$86,257
Purchase Details
Closed on
Mar 10, 2005
Sold by
Snyder Thomas G and Snyder Pamela J
Bought by
Mitchell Wanda L and Mitchell Paul
Home Financials for this Owner
Home Financials are based on the most recent Mortgage that was taken out on this home.
Original Mortgage
$78,750
Interest Rate
5.61%
Mortgage Type
Future Advance Clause Open End Mortgage
Purchase Details
Closed on
Feb 13, 2002
Bought by
Mitchell Wanda L and Paul Surv
Purchase Details
Closed on
Aug 16, 1999
Bought by
Mitchell Wanda L and Paul Surv
Create a Home Valuation Report for This Property
The Home Valuation Report is an in-depth analysis detailing your home's value as well as a comparison with similar homes in the area
Home Values in the Area
Average Home Value in this Area
Purchase History
| Date | Buyer | Sale Price | Title Company |
|---|---|---|---|
| Mitchell Paul | $125 | None Listed On Document | |
| Mitchell Wanda L | $82,900 | Marion Title | |
| Mitchell Wanda L | $61,500 | -- | |
| Mitchell Wanda L | -- | -- |
Source: Public Records
Mortgage History
| Date | Status | Borrower | Loan Amount |
|---|---|---|---|
| Open | Mitchell Paul | $100,000 | |
| Previous Owner | Mitchell Wanda L | $78,750 |
Source: Public Records
Tax History Compared to Growth
Tax History
| Year | Tax Paid | Tax Assessment Tax Assessment Total Assessment is a certain percentage of the fair market value that is determined by local assessors to be the total taxable value of land and additions on the property. | Land | Improvement |
|---|---|---|---|---|
| 2024 | $825 | $39,890 | $7,650 | $32,240 |
| 2023 | $822 | $39,890 | $7,650 | $32,240 |
| 2022 | $906 | $39,890 | $7,650 | $32,240 |
| 2021 | $1,255 | $28,610 | $6,220 | $22,390 |
| 2020 | $1,230 | $28,610 | $6,220 | $22,390 |
| 2019 | $1,266 | $28,610 | $6,220 | $22,390 |
| 2018 | $1,238 | $31,830 | $5,440 | $26,390 |
| 2017 | $1,242 | $31,830 | $5,440 | $26,390 |
| 2016 | $760 | $31,830 | $5,440 | $26,390 |
| 2015 | $764 | $31,060 | $5,180 | $25,880 |
| 2014 | $985 | $31,060 | $5,180 | $25,880 |
| 2012 | $496 | $23,120 | $5,010 | $18,110 |
Source: Public Records
Map
Nearby Homes
- 0 E Marion Cardington Rd Unit 9052845
- 0 E Marion Cardington Rd Unit 221031760
- 550 Marion Cardington Rd E
- 1513 Center Park Dr
- 1545 Center Park Dr
- 0 Republic Way Unit 225015738
- 1639 Marion Waldo Rd Unit 113
- 1639 Marion-Waldo Rd Unit 1653
- 1562 Center Park Dr
- 1480 Wellness Dr
- 0 Marion-Waldo Rd Unit 224033985
- 4.5 Acres Marion-Waldo Rd
- 1716 Marion-Waldo Rd
- Tract 1-6 Southland Pkwy
- 1051 Thomas Dr
- 692 Hampton Woods Dr
- 1290 Old Pond Dr
- 3068 Marion-Waldo Rd Unit 73
- 2280 Smeltzer Rd
- 519 Gemini Dr
- 209 Marion Cardington Rd E
- 179 Marion Cardington Rd E
- 223 Marion Cardington Rd E
- 122 Marion Cardington Rd W
- 2021 Marion Waldo Rd
- 2 Marion Waldo Rd
- 1993 Marion Waldo Rd
- 142 Marion Cardington Rd W
- 1983 Marion Waldo Rd
- 152 Marion Cardington Rd W
- 1965 Marion Waldo Rd
- 7,22 Acre Marion-Waldo Rd
- 380 Marion Cardington Rd E
- 393 Marion Cardington Rd E
- 168 Marion Cardington Rd W
- 1947 Marion Waldo Rd
- 396 Marion Cardington Rd E
- 1947 Marion-Waldo Rd
- 0 E Marion Cardington Rd Unit 2724591
- 0 E Marion Cardington Rd Unit 2724581