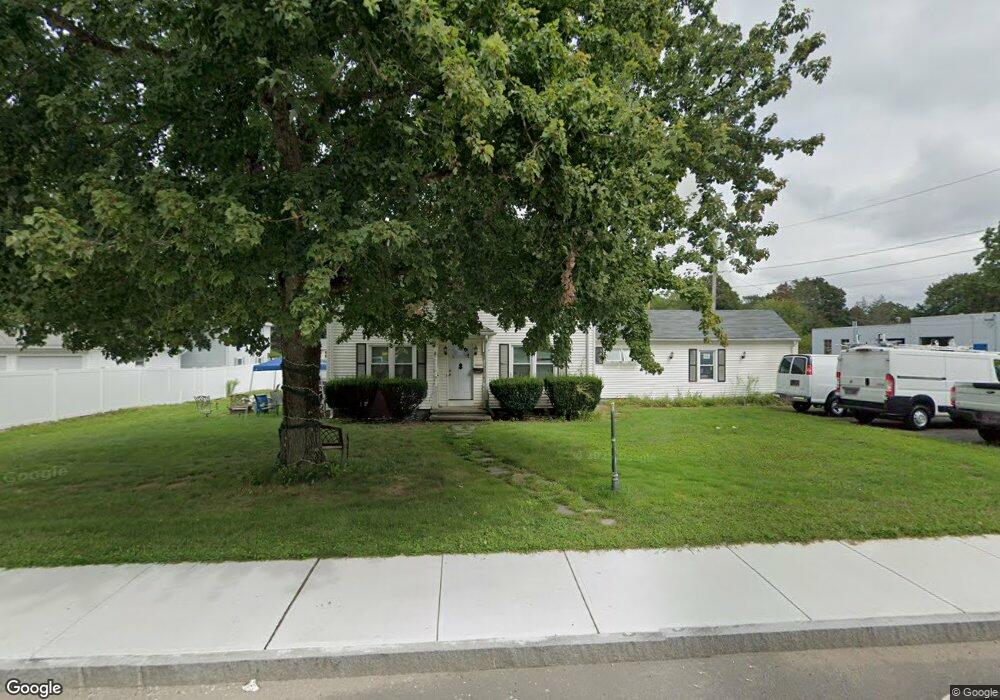
195 N Main St Unit 195 Uxbridge, MA 01569
Estimated Value: $458,000 - $503,000
5
Beds
2
Baths
2,112
Sq Ft
$226/Sq Ft
Est. Value
About This Home
This home is located at 195 N Main St Unit 195, Uxbridge, MA 01569 and is currently estimated at $476,926, approximately $225 per square foot. 195 N Main St Unit 195 is a home located in Worcester County with nearby schools including Uxbridge High School, Our Lady of the Valley Regional School, and Whitinsville Christian School.
Ownership History
Date
Name
Owned For
Owner Type
Purchase Details
Closed on
Jun 9, 2017
Sold by
Saalt Development Llc
Bought by
B & R Realty Llc
Current Estimated Value
Purchase Details
Closed on
Aug 11, 2003
Sold by
Lockley Angelina and Taylor Shirley A
Bought by
Saalt Dev Llc
Home Financials for this Owner
Home Financials are based on the most recent Mortgage that was taken out on this home.
Original Mortgage
$202,500
Interest Rate
5.28%
Mortgage Type
Purchase Money Mortgage
Purchase Details
Closed on
Apr 1, 1999
Sold by
Garden St Rt and Taylor Bruce A
Bought by
Civetta Joanne and Civetta Daniel W
Purchase Details
Closed on
Oct 1, 1997
Sold by
Cochrane Ft and Cochrane Reynold
Bought by
Garden Street Rt and Taylor Bruce A
Create a Home Valuation Report for This Property
The Home Valuation Report is an in-depth analysis detailing your home's value as well as a comparison with similar homes in the area
Home Values in the Area
Average Home Value in this Area
Purchase History
| Date | Buyer | Sale Price | Title Company |
|---|---|---|---|
| B & R Realty Llc | $225,000 | -- | |
| Saalt Dev Llc | -- | -- | |
| Civetta Joanne | $149,000 | -- | |
| Garden Street Rt | $126,500 | -- |
Source: Public Records
Mortgage History
| Date | Status | Borrower | Loan Amount |
|---|---|---|---|
| Previous Owner | Saalt Dev Llc | $202,500 | |
| Previous Owner | Garden Street Rt | $70,000 | |
| Previous Owner | Garden Street Rt | $180,000 | |
| Previous Owner | Garden Street Rt | $30,000 |
Source: Public Records
Tax History Compared to Growth
Tax History
| Year | Tax Paid | Tax Assessment Tax Assessment Total Assessment is a certain percentage of the fair market value that is determined by local assessors to be the total taxable value of land and additions on the property. | Land | Improvement |
|---|---|---|---|---|
| 2025 | $50 | $383,500 | $116,300 | $267,200 |
| 2024 | $4,708 | $364,400 | $106,600 | $257,800 |
| 2023 | $4,562 | $327,000 | $96,900 | $230,100 |
| 2022 | $4,161 | $274,500 | $87,900 | $186,600 |
| 2021 | $4,281 | $270,600 | $84,000 | $186,600 |
| 2020 | $4,297 | $256,700 | $87,300 | $169,400 |
| 2019 | $4,143 | $238,800 | $80,800 | $158,000 |
| 2018 | $4,011 | $233,600 | $80,800 | $152,800 |
| 2017 | $3,596 | $212,000 | $71,400 | $140,600 |
| 2016 | $3,748 | $213,300 | $65,500 | $147,800 |
| 2015 | $3,657 | $210,200 | $65,500 | $144,700 |
Source: Public Records
Map
Nearby Homes
- 48 Homeward Ave
- 113 Rogerson Crossing Unit 113
- 72 Homeward Ave
- 36 Elm St
- 307 N Main St
- 3 Strathmore Shire Unit A
- 129 Elm St Unit Lot 7
- 7 Jefferson Ct Unit 7
- 50 Carrington Ln
- 0 Homestead Ave
- 24 Olde Canal Way Unit 24
- 60 Tyler Dr
- 20 Nature View Dr Unit 20
- 35 Highland Park Unit 35
- 75 Lake St
- 235 Rivulet St
- Layla Plan at Pine Ridge
- Ashley Plan at Pine Ridge
- Lily Plan at Pine Ridge
- Brooklyn Plan at Pine Ridge