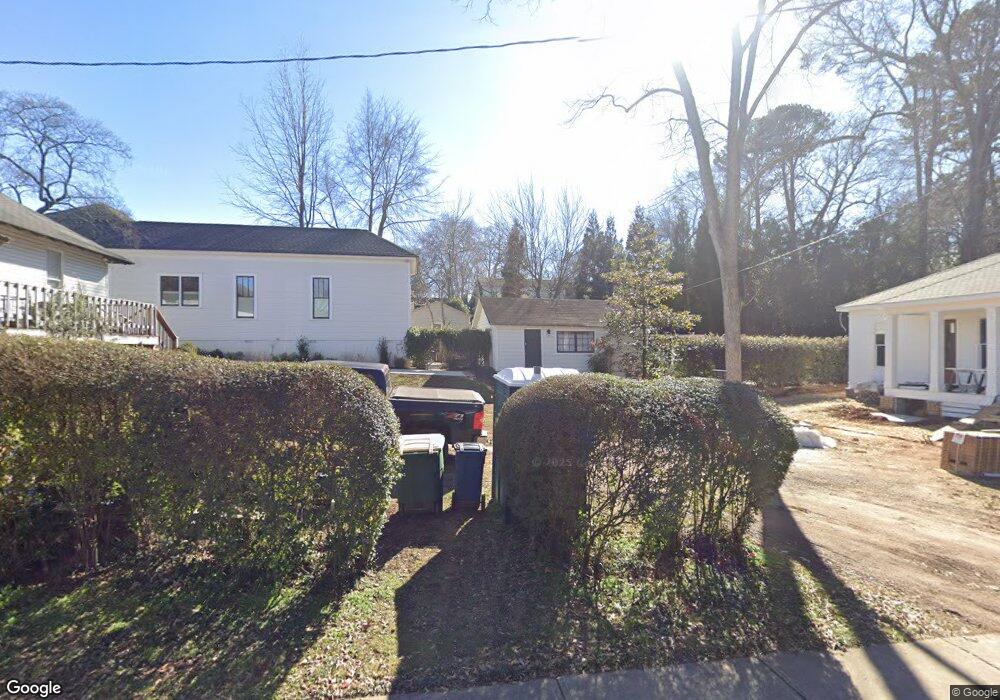
195 Ofarrell St Athens, GA 30605
Five Points NeighborhoodEstimated Value: $432,639 - $627,000
--
Bed
--
Bath
1,178
Sq Ft
$459/Sq Ft
Est. Value
About This Home
This home is located at 195 Ofarrell St, Athens, GA 30605 and is currently estimated at $541,160, approximately $459 per square foot. 195 Ofarrell St is a home located in Clarke County with nearby schools including Barrow Elementary School, Clarke Middle School, and Clarke Central High School.
Ownership History
Date
Name
Owned For
Owner Type
Purchase Details
Closed on
Oct 9, 1999
Sold by
Wilfong James Q
Bought by
Old South Investment Enterprises Llc
Current Estimated Value
Purchase Details
Closed on
Apr 1, 1997
Sold by
Popkin Josh
Bought by
Wilfong James Q
Purchase Details
Closed on
Jun 11, 1991
Sold by
Howard Kristin B
Bought by
Popkin Josh
Create a Home Valuation Report for This Property
The Home Valuation Report is an in-depth analysis detailing your home's value as well as a comparison with similar homes in the area
Home Values in the Area
Average Home Value in this Area
Purchase History
| Date | Buyer | Sale Price | Title Company |
|---|---|---|---|
| Old South Investment Enterprises Llc | -- | -- | |
| Wilfong James Q | $75,000 | -- | |
| Popkin Josh | $42,600 | -- | |
| Howard Kristin B | -- | -- |
Source: Public Records
Tax History Compared to Growth
Tax History
| Year | Tax Paid | Tax Assessment Tax Assessment Total Assessment is a certain percentage of the fair market value that is determined by local assessors to be the total taxable value of land and additions on the property. | Land | Improvement |
|---|---|---|---|---|
| 2025 | $6,602 | $239,712 | $70,000 | $169,712 |
| 2024 | $4,507 | $160,191 | $60,000 | $100,191 |
| 2023 | $4,507 | $160,191 | $60,000 | $100,191 |
| 2022 | $3,720 | $126,612 | $44,000 | $82,612 |
| 2021 | $3,556 | $115,522 | $44,000 | $71,522 |
| 2020 | $3,189 | $104,618 | $40,000 | $64,618 |
| 2019 | $3,414 | $100,546 | $40,000 | $60,546 |
| 2018 | $2,644 | $75,293 | $40,000 | $35,293 |
| 2017 | $2,435 | $71,711 | $40,000 | $31,711 |
| 2016 | $2,439 | $71,848 | $40,000 | $31,848 |
| 2015 | $2,321 | $68,278 | $40,000 | $28,278 |
| 2014 | $2,228 | $65,421 | $34,000 | $31,421 |
Source: Public Records
Map
Nearby Homes
- 515 Hampton Ct
- 221 University Dr
- 490 Ofarrell St
- 160 Riverdale Dr
- 685 Pinecrest Dr
- 183 Parkway Dr
- 1697 S Milledge Ave
- 760 E Campus Rd Unit 93
- 760 E Campus Rd Unit 95
- 655 E Campus Rd Unit 12
- 997 S Milledge Ave Unit 2
- 997 S Milledge Ave Unit 3
- 997 S Milledge Ave Unit 1
- 997 S Milledge Ave Unit 4
- 115 Annes Ct
- 50 Springdale St
- 204 Gran Ellen Dr
- 128 Habersham Dr
- 265 Annes Ct
- 255 Bloomfield St
- 185 Ofarrell St
- 179 Ofarrell St
- 0 Ofarrell St Unit 7416395
- 373 Morton Ave
- 420 Morton Ave
- 371 Morton Ave
- 135 Ofarrell St
- 363 Morton Ave
- 417 & 427 Morton Ave
- 355 Morton Ave
- 417 Morton Ave
- 427 Morton Ave
- 180 Ofarrell St
- 446 Morton Ave
- 350 Morton Ave
- 375 University Dr
- 395 University Dr
- 228 Ofarrell St
- 228 & 230 O'Farrell St
- 247 Ofarrell St
