195 Othello Dr Ellijay, GA 30540
Estimated Value: $367,949 - $426,000
--
Bed
1
Bath
1,232
Sq Ft
$324/Sq Ft
Est. Value
About This Home
This home is located at 195 Othello Dr, Ellijay, GA 30540 and is currently estimated at $399,487, approximately $324 per square foot. 195 Othello Dr is a home with nearby schools including Ellijay Elementary School, Clear Creek Elementary School, and Clear Creek Middle School.
Ownership History
Date
Name
Owned For
Owner Type
Purchase Details
Closed on
Oct 3, 2008
Sold by
Dietz Jeffrey A
Bought by
Dietz Jeffrey A and Dietz Mmelanie L
Current Estimated Value
Purchase Details
Closed on
Sep 2, 2008
Sold by
Hopkins Homes Inc
Bought by
Gilmer County Bank
Purchase Details
Closed on
Oct 2, 2007
Sold by
Hopkins Homes Inc
Bought by
Hopkins Homes Inc
Home Financials for this Owner
Home Financials are based on the most recent Mortgage that was taken out on this home.
Original Mortgage
$14,490
Interest Rate
6.65%
Mortgage Type
New Conventional
Purchase Details
Closed on
Aug 24, 2007
Sold by
Shipman Robert S
Bought by
Hopkins Homes Inc
Home Financials for this Owner
Home Financials are based on the most recent Mortgage that was taken out on this home.
Original Mortgage
$14,490
Interest Rate
6.65%
Mortgage Type
New Conventional
Purchase Details
Closed on
Jun 1, 1985
Bought by
Shipman Robert S and Shipman Carolyn D
Create a Home Valuation Report for This Property
The Home Valuation Report is an in-depth analysis detailing your home's value as well as a comparison with similar homes in the area
Home Values in the Area
Average Home Value in this Area
Purchase History
| Date | Buyer | Sale Price | Title Company |
|---|---|---|---|
| Dietz Jeffrey A | -- | -- | |
| Dietz Jeffey A | $107,500 | -- | |
| Gilmer County Bank | -- | -- | |
| Hopkins Homes Inc | $179,000 | -- | |
| Hopkins Homes Inc | $14,500 | -- | |
| Shipman Robert S | -- | -- |
Source: Public Records
Mortgage History
| Date | Status | Borrower | Loan Amount |
|---|---|---|---|
| Previous Owner | Hopkins Homes Inc | $14,490 |
Source: Public Records
Tax History Compared to Growth
Tax History
| Year | Tax Paid | Tax Assessment Tax Assessment Total Assessment is a certain percentage of the fair market value that is determined by local assessors to be the total taxable value of land and additions on the property. | Land | Improvement |
|---|---|---|---|---|
| 2024 | $2,501 | $161,440 | $3,400 | $158,040 |
| 2023 | $2,366 | $147,920 | $2,920 | $145,000 |
| 2022 | $2,248 | $127,760 | $2,000 | $125,760 |
| 2021 | $1,999 | $100,720 | $2,000 | $98,720 |
| 2020 | $1,687 | $76,680 | $1,920 | $74,760 |
| 2019 | $1,731 | $76,440 | $1,680 | $74,760 |
| 2018 | $1,680 | $73,240 | $1,680 | $71,560 |
| 2017 | $1,522 | $61,880 | $2,000 | $59,880 |
| 2016 | $1,569 | $62,520 | $2,000 | $60,520 |
| 2015 | $1,200 | $48,680 | $1,800 | $46,880 |
| 2014 | $1,124 | $43,880 | $1,800 | $42,080 |
| 2013 | -- | $45,720 | $1,800 | $43,920 |
Source: Public Records
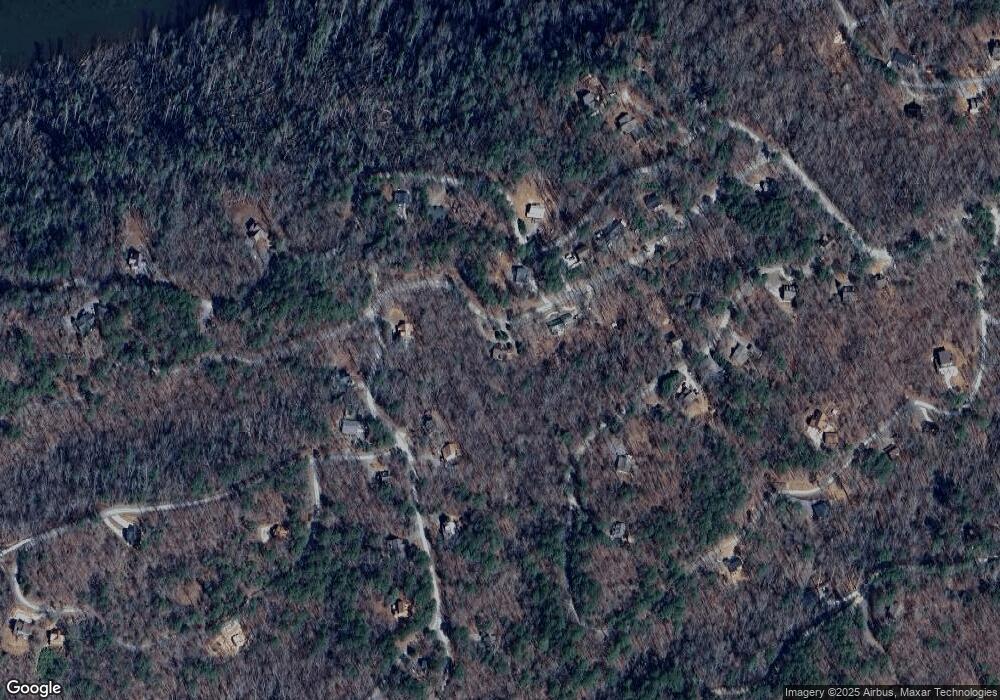
Map
Nearby Homes
- 155 Othello Dr
- 168 Othello Dr
- 91 Monet Dr Unit 965
- 91 Monet Dr
- 111 Monet Dr Unit 1088
- 111 Monet Dr
- 150 Othello Dr Unit 917
- 150 Othello Dr
- L1147 Monet Dr Unit 1147
- L1147 Monet Dr
- LOT 9 Mt Springer Rd
- 0 Monet Dr Unit 1147 8229176
- 0 Monet Dr Unit L 1086 3165440
- 0 Monet Dr Unit 1147 7402230
- 0 Monet Dr Unit 10388118
- 0 Monet Dr Unit 327699
- 0 Monet Dr Unit 1143 7591447
- 0 Monet Dr Unit 7218225
- 0 Monet Dr Unit 8956994
- 0 Monet Dr Unit Lot 1089 8513688