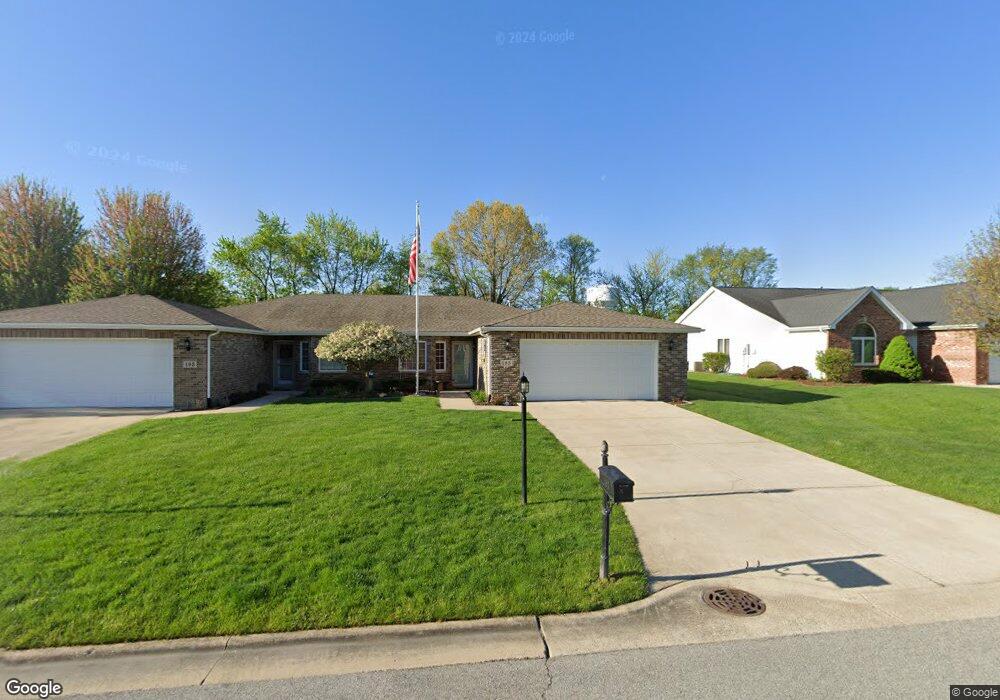
195 Polly Ln Hobart, IN 46342
Estimated Value: $266,347 - $279,000
2
Beds
2
Baths
1,580
Sq Ft
$173/Sq Ft
Est. Value
About This Home
This home is located at 195 Polly Ln, Hobart, IN 46342 and is currently estimated at $272,837, approximately $172 per square foot. 195 Polly Ln is a home located in Lake County with nearby schools including Hobart High School, Trinity Lutheran School, and Hobart Baptist School.
Ownership History
Date
Name
Owned For
Owner Type
Purchase Details
Closed on
Apr 12, 2010
Sold by
Laurawood Inc
Bought by
Laurawood Ii Homeowners Association Inc
Current Estimated Value
Purchase Details
Closed on
Jan 31, 2008
Sold by
Ramm Builders Inc
Bought by
Mance Philip A and Mance Linda M
Home Financials for this Owner
Home Financials are based on the most recent Mortgage that was taken out on this home.
Original Mortgage
$161,500
Interest Rate
6.11%
Mortgage Type
Unknown
Create a Home Valuation Report for This Property
The Home Valuation Report is an in-depth analysis detailing your home's value as well as a comparison with similar homes in the area
Home Values in the Area
Average Home Value in this Area
Purchase History
| Date | Buyer | Sale Price | Title Company |
|---|---|---|---|
| Laurawood Ii Homeowners Association Inc | -- | None Available | |
| Mance Philip A | -- | Chicago Title Insurance Co |
Source: Public Records
Mortgage History
| Date | Status | Borrower | Loan Amount |
|---|---|---|---|
| Previous Owner | Mance Philip A | $161,500 |
Source: Public Records
Tax History Compared to Growth
Tax History
| Year | Tax Paid | Tax Assessment Tax Assessment Total Assessment is a certain percentage of the fair market value that is determined by local assessors to be the total taxable value of land and additions on the property. | Land | Improvement |
|---|---|---|---|---|
| 2024 | $2,539 | $222,800 | $33,600 | $189,200 |
| 2023 | $2,279 | $196,800 | $33,600 | $163,200 |
| 2022 | $2,279 | $190,100 | $33,600 | $156,500 |
| 2021 | $2,077 | $172,400 | $28,000 | $144,400 |
| 2020 | $2,006 | $167,500 | $28,000 | $139,500 |
| 2019 | $2,155 | $162,500 | $28,000 | $134,500 |
| 2018 | $2,232 | $157,300 | $28,000 | $129,300 |
| 2017 | $2,098 | $146,800 | $28,400 | $118,400 |
| 2016 | $1,966 | $140,700 | $28,400 | $112,300 |
| 2014 | $1,628 | $130,000 | $28,400 | $101,600 |
| 2013 | $1,633 | $130,000 | $28,400 | $101,600 |
Source: Public Records
Map
Nearby Homes
- 1328 S Lake Park Ave
- 1075-1085 S Lake Park Ave
- 940 Penny Ct
- 600 W 10th St
- 930 Penny Ct
- 303 W 8th Place
- 945 Paula Ct
- 935 Paula Ct
- 925 Paula Ct
- 1075 S Virginia St
- 915 Paula Ct
- 1446 Lake St
- 1450 Lake St
- 1215 Lincoln St
- 816 Water St
- 1576 Lilac Ct
- 925 State St
- 1592 Lilac Ct
- 1320 Garfield St
- 5601 E 61st Ave