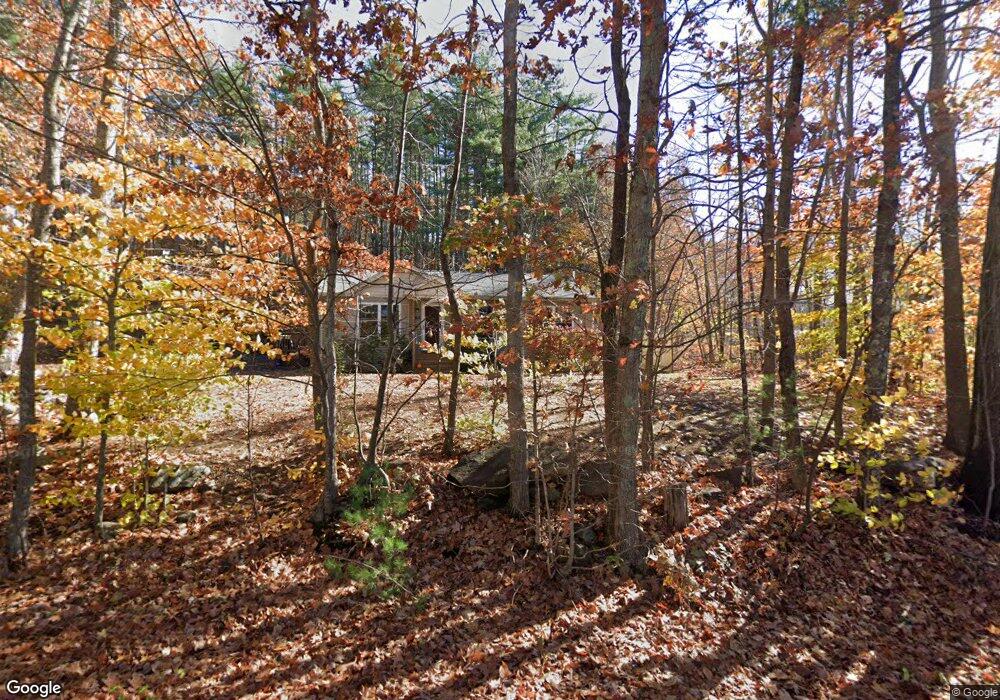
195 Ridley Rd Springvale, ME 04083
Estimated Value: $355,000 - $396,853
3
Beds
1
Bath
960
Sq Ft
$388/Sq Ft
Est. Value
About This Home
This home is located at 195 Ridley Rd, Springvale, ME 04083 and is currently estimated at $372,713, approximately $388 per square foot. 195 Ridley Rd is a home with nearby schools including St Thomas Consolidated School and Sanford Christian Academy.
Ownership History
Date
Name
Owned For
Owner Type
Purchase Details
Closed on
Mar 17, 2023
Sold by
Marr David P
Bought by
Loranger Sarah L and Loranger Kevin W
Current Estimated Value
Home Financials for this Owner
Home Financials are based on the most recent Mortgage that was taken out on this home.
Original Mortgage
$334,823
Outstanding Balance
$323,471
Interest Rate
6.09%
Mortgage Type
FHA
Estimated Equity
$49,242
Purchase Details
Closed on
Nov 14, 2016
Sold by
Drake Tyler and Drake Kaileigh
Bought by
Marr David P
Home Financials for this Owner
Home Financials are based on the most recent Mortgage that was taken out on this home.
Original Mortgage
$176,262
Interest Rate
3.42%
Mortgage Type
New Conventional
Purchase Details
Closed on
Jul 3, 2014
Sold by
Lavigne Ronald J and Lavigne Jane M
Bought by
Drake Tyler and Drake Kaileigh
Home Financials for this Owner
Home Financials are based on the most recent Mortgage that was taken out on this home.
Original Mortgage
$166,900
Interest Rate
4.16%
Mortgage Type
New Conventional
Create a Home Valuation Report for This Property
The Home Valuation Report is an in-depth analysis detailing your home's value as well as a comparison with similar homes in the area
Home Values in the Area
Average Home Value in this Area
Purchase History
| Date | Buyer | Sale Price | Title Company |
|---|---|---|---|
| Loranger Sarah L | $341,000 | None Available | |
| Marr David P | -- | -- | |
| Drake Tyler | -- | -- |
Source: Public Records
Mortgage History
| Date | Status | Borrower | Loan Amount |
|---|---|---|---|
| Open | Loranger Sarah L | $334,823 | |
| Previous Owner | Marr David P | $176,262 | |
| Previous Owner | Drake Tyler | $166,900 |
Source: Public Records
Tax History
| Year | Tax Paid | Tax Assessment Tax Assessment Total Assessment is a certain percentage of the fair market value that is determined by local assessors to be the total taxable value of land and additions on the property. | Land | Improvement |
|---|---|---|---|---|
| 2025 | $4,350 | $254,400 | $50,500 | $203,900 |
| 2024 | $4,106 | $254,400 | $50,500 | $203,900 |
| 2023 | $3,820 | $252,300 | $50,500 | $201,800 |
| 2022 | $3,734 | $252,300 | $50,500 | $201,800 |
| 2021 | $3,711 | $204,100 | $50,500 | $153,600 |
| 2020 | $3,633 | $180,200 | $50,500 | $129,700 |
| 2019 | $3,496 | $168,900 | $50,500 | $118,400 |
| 2018 | $3,307 | $161,300 | $45,600 | $115,700 |
| 2017 | $3,186 | $153,600 | $45,600 | $108,000 |
| 2016 | $3,250 | $142,900 | $45,400 | $97,500 |
| 2015 | $3,229 | $146,500 | $50,300 | $96,200 |
| 2014 | $3,022 | $148,200 | $52,000 | $96,200 |
| 2013 | -- | $155,800 | $58,600 | $97,200 |
Source: Public Records
Map
Nearby Homes
- R6-41-S5 Ridley Rd
- R6-41-S6 Ridley Rd
- R6-41-S3 Railroad Ave
- R6-41-S2 Railroad Ave
- R6-41-S4 Railroad Ave
- 21 Signal St Unit I-3
- 2 Libby Ln
- 19 Signal St Unit I-2
- 11 Nathan Ct
- 17 Signal St Unit I-1
- 27 Weeman St
- 5 Allenson St
- 14 Webster St
- Lot 650 Gebung Rd
- 51 Pleasant St
- 45 Payne St
- 6 Harris St
- 39 Payne St
- TBD Elm St
- 14 Pleasant St
Your Personal Tour Guide
Ask me questions while you tour the home.