Estimated Value: $268,000 - $316,000
2
Beds
2
Baths
1,272
Sq Ft
$222/Sq Ft
Est. Value
About This Home
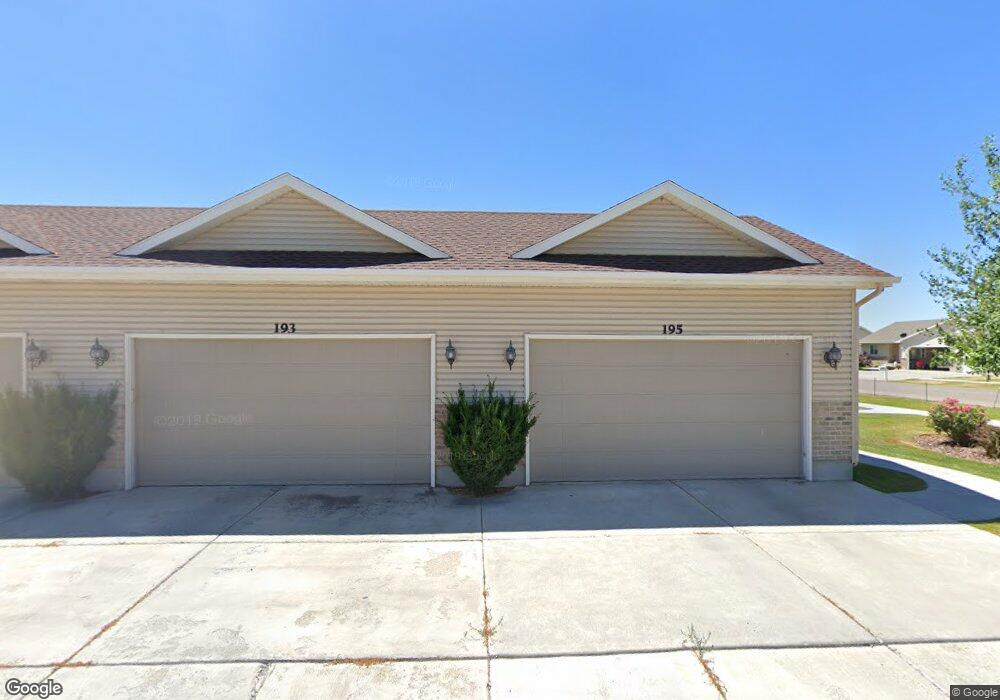
This home is located at 195 Robison Dr Unit 13, Ammon, ID 83406 and is currently estimated at $281,967, approximately $221 per square foot. 195 Robison Dr Unit 13 is a home located in Bonneville County with nearby schools including Hillview Elementary School, Sandcreek Middle School, and Hillcrest High School.
Ownership History
Date
Name
Owned For
Owner Type
Purchase Details
Closed on
Dec 16, 2021
Sold by
Chasewood Ammon Property Fund
Bought by
Kiker William T
Current Estimated Value
Home Financials for this Owner
Home Financials are based on the most recent Mortgage that was taken out on this home.
Original Mortgage
$256,500
Outstanding Balance
$236,258
Interest Rate
3.22%
Mortgage Type
New Conventional
Estimated Equity
$45,709
Purchase Details
Closed on
Feb 16, 2021
Sold by
Smith Candra
Bought by
William Kiker Legal Owner Via Non Trust
Purchase Details
Closed on
Jun 30, 2009
Sold by
Fleming Dennis J and Fleming Lisa Marie
Bought by
Smith Candra A
Home Financials for this Owner
Home Financials are based on the most recent Mortgage that was taken out on this home.
Original Mortgage
$114,880
Interest Rate
4.79%
Mortgage Type
FHA
Purchase Details
Closed on
Jul 12, 2007
Sold by
Centennial Ranch Homes Llc
Bought by
Fleming Dennis J
Create a Home Valuation Report for This Property
The Home Valuation Report is an in-depth analysis detailing your home's value as well as a comparison with similar homes in the area
Purchase History
| Date | Buyer | Sale Price | Title Company |
|---|---|---|---|
| Kiker William T | -- | Title One Title | |
| William Kiker Legal Owner Via Non Trust | -- | First American Ttl Id Falls | |
| Smith Candra A | -- | -- | |
| Fleming Dennis J | -- | None Available |
Source: Public Records
Mortgage History
| Date | Status | Borrower | Loan Amount |
|---|---|---|---|
| Open | Kiker William T | $256,500 | |
| Previous Owner | Smith Candra A | $114,880 |
Source: Public Records
Tax History
| Year | Tax Paid | Tax Assessment Tax Assessment Total Assessment is a certain percentage of the fair market value that is determined by local assessors to be the total taxable value of land and additions on the property. | Land | Improvement |
|---|---|---|---|---|
| 2025 | $1,671 | $231,896 | $15,628 | $216,268 |
| 2024 | $1,690 | $240,040 | $12,810 | $227,230 |
| 2023 | $1,658 | $232,850 | $12,810 | $220,040 |
| 2022 | $1,698 | $206,625 | $11,585 | $195,040 |
| 2021 | $829 | $138,420 | $10,530 | $127,890 |
| 2019 | $921 | $118,372 | $9,152 | $109,220 |
| 2018 | $848 | $124,238 | $9,338 | $114,900 |
| 2017 | $783 | $110,671 | $7,631 | $103,040 |
| 2016 | $775 | $101,648 | $6,938 | $94,710 |
| 2015 | $734 | $96,588 | $6,938 | $89,650 |
| 2014 | $13,981 | $96,588 | $6,938 | $89,650 |
| 2013 | $703 | $93,888 | $6,938 | $86,950 |
Source: Public Records
Map
Nearby Homes
- 171 Robison Dr
- 243 S Bridger Dr
- 4139 Fairview Dr
- 141 Robison Dr
- 250 Butterfly Dr
- 225 Monte Vista Ave
- 265 S Heath Ln
- 4353 Stubblefield Ct
- 169 S Heath Ln
- 3930 John Adams Pkwy
- 660 Butterfly Dr
- 4170 E Spartina
- 596 S Adam Ln
- 820 S Adam Ln
- 978 Edinburg Cir
- 3617 E Daleen
- 5941 N Freedom Rd
- 605 Maurine Dr
- 3823 E Summerridge Cir
- 3838 Summerridge Cir
- 195 Robison Dr
- 195 Robison Dr
- 193 Robison Dr
- 191 Robison Dr
- 189 Robison Dr
- 189 Robison Dr Unit 16
- 185 Robison Dr
- 183 Robison Dr
- 4095 Mathews Dr
- 181 Robison Dr
- 181 Robison Dr
- 4103 Mathews Dr
- 113 Robison Dr
- 115 Robison Dr
- 180 Robison Dr
- 179 Robison Dr
- 117 Robison Dr
- 111 Robison Dr
- 194 Robison Dr
- 4127 Mathews Dr
Your Personal Tour Guide
Ask me questions while you tour the home.