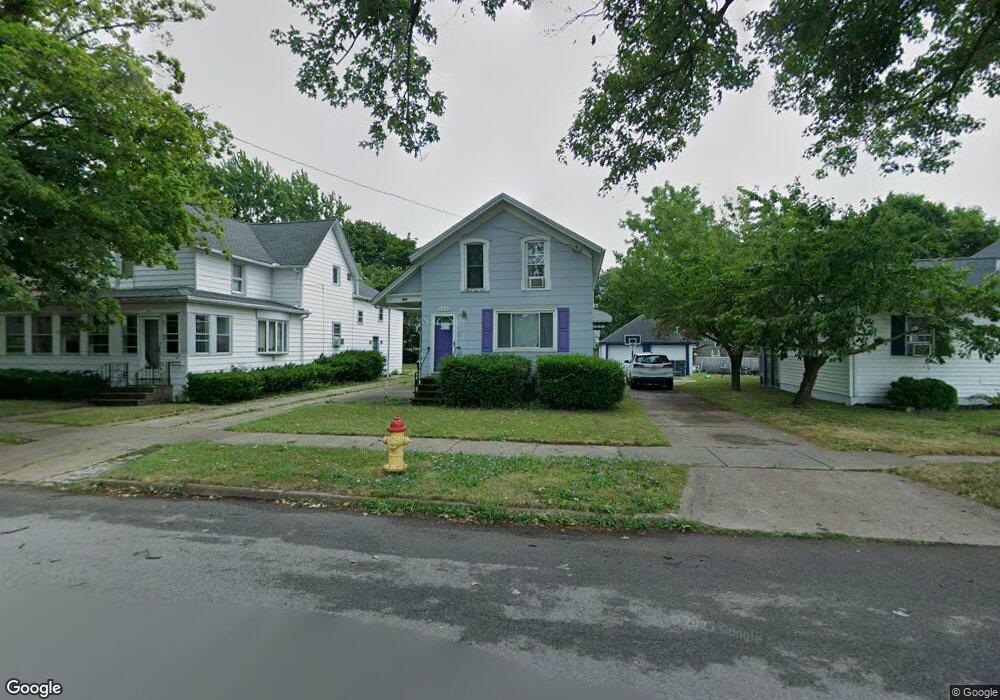
195 Sommer St North Tonawanda, NY 14120
Estimated Value: $155,000 - $192,000
3
Beds
1
Bath
1,325
Sq Ft
$128/Sq Ft
Est. Value
About This Home
This home is located at 195 Sommer St, North Tonawanda, NY 14120 and is currently estimated at $169,733, approximately $128 per square foot. 195 Sommer St is a home located in Niagara County with nearby schools including North Tonawanda Intermediate School and St Matthew Lutheran School.
Ownership History
Date
Name
Owned For
Owner Type
Purchase Details
Closed on
Jul 13, 2009
Sold by
Perry Janet
Bought by
Wetzel Steven
Current Estimated Value
Home Financials for this Owner
Home Financials are based on the most recent Mortgage that was taken out on this home.
Original Mortgage
$61,858
Outstanding Balance
$39,586
Interest Rate
4.93%
Mortgage Type
FHA
Estimated Equity
$130,147
Purchase Details
Closed on
Aug 25, 1997
Sold by
Vallio James
Bought by
Perry Janet L
Create a Home Valuation Report for This Property
The Home Valuation Report is an in-depth analysis detailing your home's value as well as a comparison with similar homes in the area
Home Values in the Area
Average Home Value in this Area
Purchase History
| Date | Buyer | Sale Price | Title Company |
|---|---|---|---|
| Wetzel Steven | $63,000 | Raymond Caso | |
| Wetzel Steven | $63,000 | None Available | |
| Perry Janet L | $51,000 | -- |
Source: Public Records
Mortgage History
| Date | Status | Borrower | Loan Amount |
|---|---|---|---|
| Open | Wetzel Steven | $61,858 |
Source: Public Records
Tax History Compared to Growth
Tax History
| Year | Tax Paid | Tax Assessment Tax Assessment Total Assessment is a certain percentage of the fair market value that is determined by local assessors to be the total taxable value of land and additions on the property. | Land | Improvement |
|---|---|---|---|---|
| 2024 | $1,974 | $55,900 | $13,500 | $42,400 |
| 2023 | $1,925 | $55,900 | $13,500 | $42,400 |
| 2022 | $1,455 | $55,900 | $13,500 | $42,400 |
| 2021 | $1,419 | $55,900 | $13,500 | $42,400 |
| 2020 | $1,342 | $55,900 | $13,500 | $42,400 |
| 2019 | $859 | $55,900 | $13,500 | $42,400 |
| 2018 | $1,280 | $55,900 | $13,500 | $42,400 |
| 2017 | $1,234 | $55,900 | $13,500 | $42,400 |
| 2016 | $1,178 | $55,900 | $13,500 | $42,400 |
| 2015 | -- | $55,900 | $13,500 | $42,400 |
| 2014 | -- | $55,900 | $13,500 | $42,400 |
Source: Public Records
Map
Nearby Homes