195 Stovall Rd Extension Lavonia, GA 30553
Estimated Value: $782,021 - $1,033,000
3
Beds
3
Baths
2,490
Sq Ft
$353/Sq Ft
Est. Value
About This Home
This home is located at 195 Stovall Rd Extension, Lavonia, GA 30553 and is currently estimated at $879,255, approximately $353 per square foot. 195 Stovall Rd Extension is a home located in Franklin County with nearby schools including Franklin County High School.
Ownership History
Date
Name
Owned For
Owner Type
Purchase Details
Closed on
Jun 27, 2017
Sold by
Chandler Christopher P
Bought by
Langston William V and Langston Leslie R
Current Estimated Value
Home Financials for this Owner
Home Financials are based on the most recent Mortgage that was taken out on this home.
Original Mortgage
$108,000
Outstanding Balance
$57,115
Interest Rate
3.94%
Mortgage Type
New Conventional
Estimated Equity
$822,141
Purchase Details
Closed on
Mar 15, 2005
Sold by
Broxton John P
Bought by
Chandler Christopher P
Home Financials for this Owner
Home Financials are based on the most recent Mortgage that was taken out on this home.
Original Mortgage
$156,750
Interest Rate
5.88%
Mortgage Type
New Conventional
Purchase Details
Closed on
Oct 16, 2001
Sold by
Broxton Carolyn P
Bought by
Broxton John P
Purchase Details
Closed on
Jul 27, 1998
Bought by
Broxton Carolyn P
Create a Home Valuation Report for This Property
The Home Valuation Report is an in-depth analysis detailing your home's value as well as a comparison with similar homes in the area
Home Values in the Area
Average Home Value in this Area
Purchase History
| Date | Buyer | Sale Price | Title Company |
|---|---|---|---|
| Langston William V | $145,000 | -- | |
| Chandler Christopher P | $165,000 | -- | |
| Broxton John P | -- | -- | |
| Broxton Carolyn P | -- | -- |
Source: Public Records
Mortgage History
| Date | Status | Borrower | Loan Amount |
|---|---|---|---|
| Open | Langston William V | $108,000 | |
| Previous Owner | Chandler Christopher P | $156,750 |
Source: Public Records
Tax History Compared to Growth
Tax History
| Year | Tax Paid | Tax Assessment Tax Assessment Total Assessment is a certain percentage of the fair market value that is determined by local assessors to be the total taxable value of land and additions on the property. | Land | Improvement |
|---|---|---|---|---|
| 2024 | $5,211 | $220,903 | $79,200 | $141,703 |
| 2023 | $5,347 | $209,257 | $79,200 | $130,057 |
| 2022 | $5,074 | $198,673 | $79,200 | $119,473 |
| 2021 | $3,330 | $121,024 | $57,600 | $63,424 |
| 2020 | $1,831 | $65,847 | $57,600 | $8,247 |
| 2019 | $1,752 | $65,207 | $57,600 | $7,607 |
| 2018 | $1,655 | $61,600 | $57,600 | $4,000 |
| 2017 | $1,721 | $61,600 | $57,600 | $4,000 |
| 2016 | $1,798 | $61,600 | $57,600 | $4,000 |
| 2015 | -- | $57,600 | $57,600 | $0 |
| 2014 | -- | $57,600 | $57,600 | $0 |
| 2013 | -- | $57,600 | $57,600 | $0 |
Source: Public Records
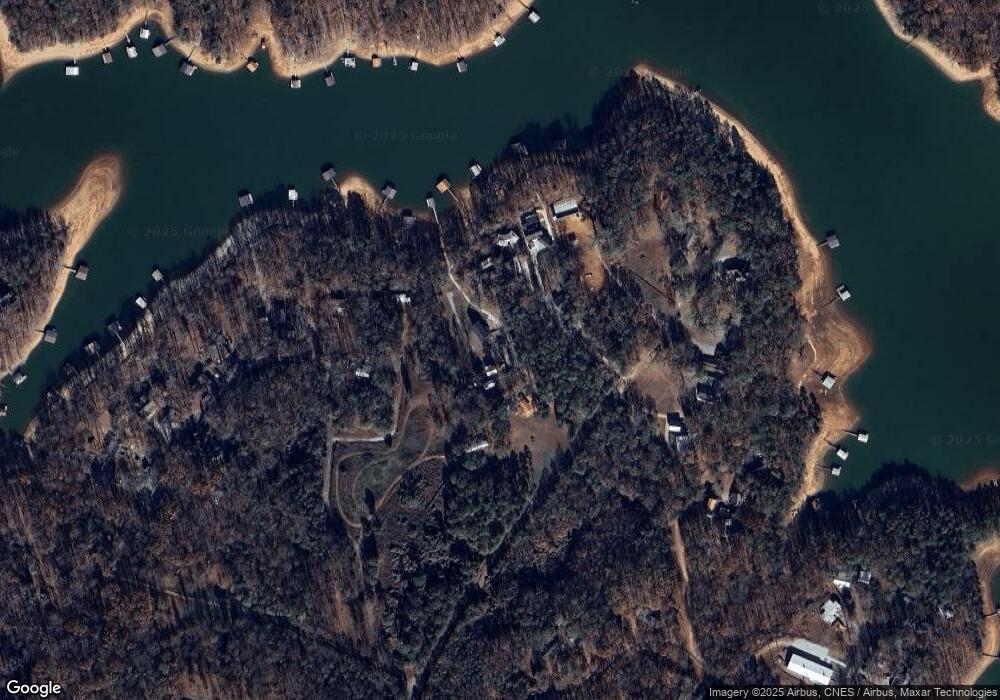
Map
Nearby Homes
- 195 Stovall Ext Rd
- 0 Brittany Cove Cir
- 386 Brittany Cove Cir
- 386 Brittany Cove
- 910 Knottywood Dr
- 20 Waterwood Place
- 0 Ridgeview Ct Unit 10466670
- LOT 28 Knottywood Dr
- 933 Rue Fluer de Lis
- 990 Rue Fluer de Lis
- 103 Tugalo Point
- 225 Rue Chalet
- 0 Rue Cezzan Unit 7627310
- 0 Rue Cezzan Unit 10579900
- 0 Rue St Joan Unit 10505288
- 375 Rue Cezzan
- 220 de La Taix
- 387 Chateau Dr
- 0 Rue Fleur de Lis Unit 20291026
- LOT 90 Rue Fluer de Lis
- 227 Stovall Rd
- 201 Stovall Rd
- 201 Stovall Rd Unit EXT
- 764 Bulldog Cir
- 774 Bulldog Cir
- 760 Bulldog Cir Unit LOT 2
- 760 Bulldog Cir
- 770 Bulldog Cir
- 271 Stovall Rd
- 227 Stovall Rd Extension
- 0 Stovall Rd Extension Unit 7057670
- 0 Stovall Rd Extension Unit 7514772
- 0 Stovall Rd Extension Unit 7393017
- 0 Stovall Rd Extension Unit 7144064
- 0 Stovall Rd Extension Unit LOT 1 3020880
- 0 Stovall Rd Extension
- 780 Bulldog Cir
- 268 Stovall Road Extension
- 250 Stovall Rd
- 315 Stovall Road Extension