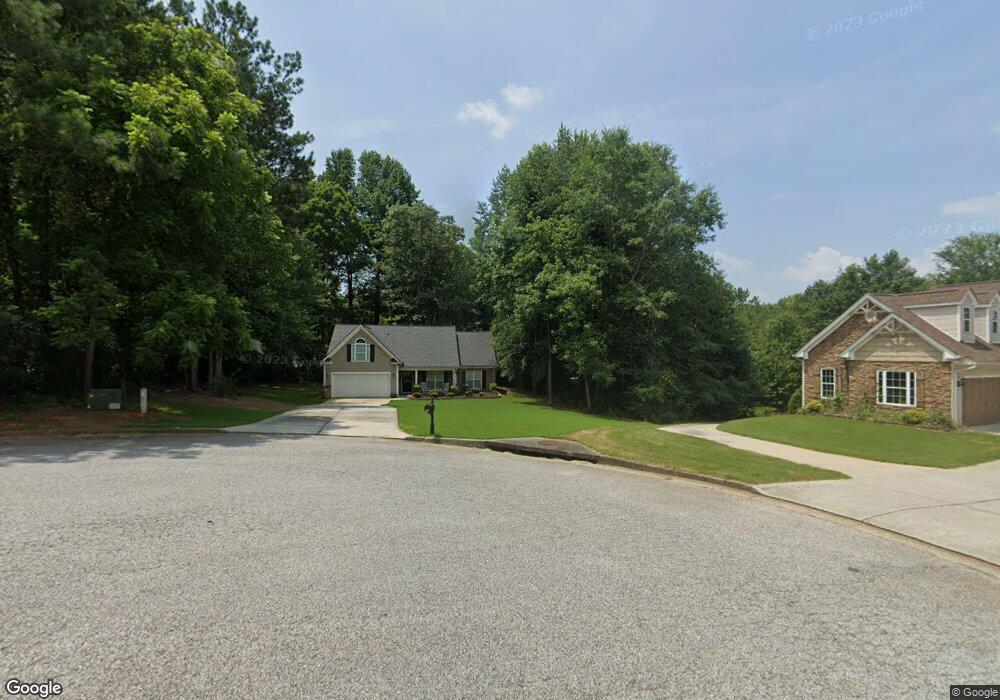
195 Terrell Ln Jefferson, GA 30549
Estimated Value: $372,389 - $429,000
--
Bed
2
Baths
1,978
Sq Ft
$204/Sq Ft
Est. Value
About This Home
This home is located at 195 Terrell Ln, Jefferson, GA 30549 and is currently estimated at $404,097, approximately $204 per square foot. 195 Terrell Ln is a home located in Jackson County with nearby schools including Gum Springs Elementary School, West Jackson Middle School, and Jackson County High School.
Ownership History
Date
Name
Owned For
Owner Type
Purchase Details
Closed on
Feb 28, 2006
Sold by
Not Provided
Bought by
Berry Chadwick G
Current Estimated Value
Home Financials for this Owner
Home Financials are based on the most recent Mortgage that was taken out on this home.
Original Mortgage
$154,150
Outstanding Balance
$87,222
Interest Rate
6.19%
Mortgage Type
New Conventional
Estimated Equity
$316,875
Purchase Details
Closed on
Sep 16, 2004
Sold by
Green Clinton
Bought by
Fairhaven Enterprises Inc
Create a Home Valuation Report for This Property
The Home Valuation Report is an in-depth analysis detailing your home's value as well as a comparison with similar homes in the area
Home Values in the Area
Average Home Value in this Area
Purchase History
| Date | Buyer | Sale Price | Title Company |
|---|---|---|---|
| Berry Chadwick G | $162,300 | -- | |
| Fairhaven Enterprises Inc | -- | -- | |
| Fairhaven Enterprises Inc | $42,000 | -- |
Source: Public Records
Mortgage History
| Date | Status | Borrower | Loan Amount |
|---|---|---|---|
| Open | Berry Chadwick G | $154,150 |
Source: Public Records
Tax History Compared to Growth
Tax History
| Year | Tax Paid | Tax Assessment Tax Assessment Total Assessment is a certain percentage of the fair market value that is determined by local assessors to be the total taxable value of land and additions on the property. | Land | Improvement |
|---|---|---|---|---|
| 2024 | $3,123 | $122,320 | $26,000 | $96,320 |
| 2023 | $3,123 | $111,960 | $26,000 | $85,960 |
| 2022 | $2,727 | $95,600 | $26,000 | $69,600 |
| 2021 | $2,394 | $83,600 | $14,000 | $69,600 |
| 2020 | $2,216 | $71,000 | $14,000 | $57,000 |
| 2019 | $2,249 | $71,000 | $14,000 | $57,000 |
| 2018 | $2,185 | $68,200 | $14,000 | $54,200 |
| 2017 | $2,065 | $64,050 | $14,000 | $50,050 |
| 2016 | $1,943 | $60,050 | $10,000 | $50,050 |
| 2015 | $1,940 | $60,050 | $10,000 | $50,050 |
| 2014 | $1,789 | $55,429 | $10,000 | $45,429 |
| 2013 | -- | $55,429 | $10,000 | $45,429 |
Source: Public Records
Map
Nearby Homes
- 2274 Georgia 124
- 2236 Georgia 124
- 0 Creek Nation Rd Unit TRACT 2
- 0 Creek Nation Rd Unit 10599350
- 285 Meadowcreek Dr
- 241 Jones Rd
- 335 Jones Rd
- 2932 Highway 124 W
- 117 Hampton Rdge Way
- 103 Hampton Rdge Way
- 90 Hampton Rdge Way
- Brentwood Plan at Hampton Ridge
- Lexington Plan at Hampton Ridge
- Graham Plan at Hampton Ridge
- Reynolds Plan at Hampton Ridge
- Crofton Plan at Hampton Ridge
- Turnbridge Plan at Hampton Ridge
- Clayton Plan at Hampton Ridge
- 110 Hampton Hollow Dr