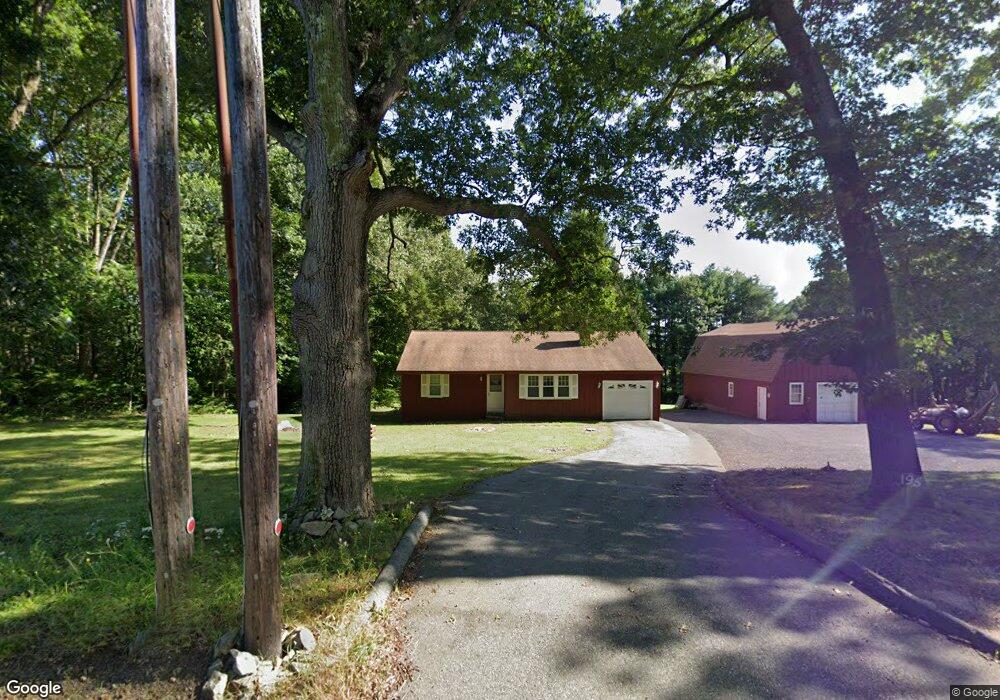
195 Thompson Rd Thompson, CT 06277
Estimated Value: $429,000 - $496,000
3
Beds
2
Baths
1,307
Sq Ft
$352/Sq Ft
Est. Value
About This Home
This home is located at 195 Thompson Rd, Thompson, CT 06277 and is currently estimated at $459,767, approximately $351 per square foot. 195 Thompson Rd is a home located in Windham County with nearby schools including Mary R. Fisher Elementary School, Thompson Middle School, and Tourtellotte Memorial High School.
Ownership History
Date
Name
Owned For
Owner Type
Purchase Details
Closed on
Mar 15, 2004
Sold by
Stoll Charles G and Stoll Constance S
Bought by
Arruda Joseph F
Current Estimated Value
Home Financials for this Owner
Home Financials are based on the most recent Mortgage that was taken out on this home.
Original Mortgage
$261,250
Interest Rate
5.67%
Create a Home Valuation Report for This Property
The Home Valuation Report is an in-depth analysis detailing your home's value as well as a comparison with similar homes in the area
Home Values in the Area
Average Home Value in this Area
Purchase History
We collect this data history from publicly available records. To have your information removed, we recommend requesting removal directly through your county’s website.
| Date | Buyer | Sale Price | Title Company |
|---|---|---|---|
| Arruda Joseph F | $275,000 | -- | |
| Arruda Joseph F | $275,000 | -- |
Source: Public Records
Mortgage History
We collect this data history from publicly available records. To have your information removed, we recommend requesting removal directly through your county’s website.
| Date | Status | Borrower | Loan Amount |
|---|---|---|---|
| Open | Arruda Joseph F | $236,000 | |
| Closed | Arruda Joseph F | $29,480 | |
| Closed | Arruda Joseph F | $261,250 |
Source: Public Records
Tax History
| Year | Tax Paid | Tax Assessment Tax Assessment Total Assessment is a certain percentage of the fair market value that is determined by local assessors to be the total taxable value of land and additions on the property. | Land | Improvement |
|---|---|---|---|---|
| 2025 | $5,314 | $279,700 | $64,400 | $215,300 |
| 2024 | $4,678 | $166,400 | $51,900 | $114,500 |
| 2023 | $4,326 | $166,400 | $51,900 | $114,500 |
| 2022 | $4,163 | $166,400 | $51,900 | $114,500 |
| 2021 | $4,152 | $166,400 | $51,900 | $114,500 |
| 2020 | $4,032 | $166,400 | $51,900 | $114,500 |
| 2019 | $4,151 | $149,600 | $55,000 | $94,600 |
| 2018 | $4,151 | $149,600 | $55,000 | $94,600 |
| 2017 | $3,899 | $149,600 | $55,000 | $94,600 |
| 2016 | $3,899 | $149,600 | $55,000 | $94,600 |
| 2015 | $3,710 | $149,600 | $55,000 | $94,600 |
| 2014 | $3,645 | $159,400 | $58,000 | $101,400 |
Source: Public Records
Map
Nearby Homes
- 1 Maple Ln
- 17 Quaddick Rd
- 3 Westside Dr Unit 17
- 3 Westside Dr Unit 14
- 369 Thompson Rd
- 46 Klondike St
- 38 Madison Ave
- 56 Thompson Hill Rd
- 309 Oleary Rd
- 210 Hill Rd
- 100 Hawkins Rd
- 115 Groveland Ave
- 115 Groveland Ave Unit 7 & 8
- 0 W Thompson Rd Unit 24146108
- 158 Church St
- 47 Groveland Ave
- 43 Groveland Ave
- 70 Elvira Heights
- 55 Mechanics St
- 215 Walnut St
Your Personal Tour Guide
Ask me questions while you tour the home.