Estimated Value: $362,000 - $522,000
3
Beds
2
Baths
1,328
Sq Ft
$317/Sq Ft
Est. Value
About This Home
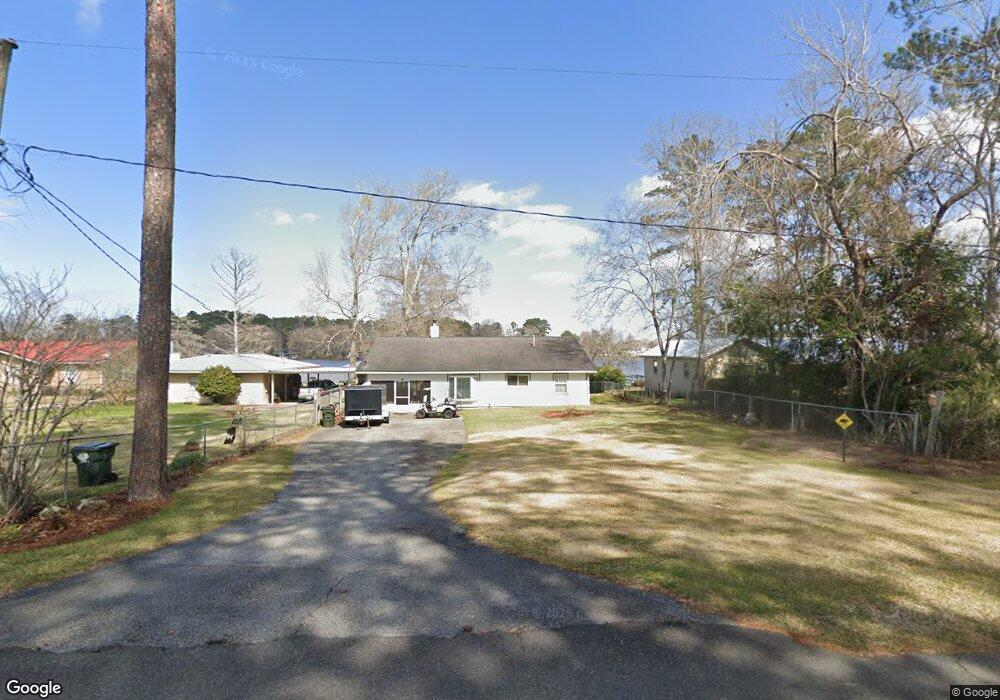
This home is located at 195 Tommy Warren Dr, Cobb, GA 31735 and is currently estimated at $420,754, approximately $316 per square foot. 195 Tommy Warren Dr is a home located in Sumter County with nearby schools including Sumter County Primary School, Sumter County Elementary School, and Sumter County Middle School.
Ownership History
Date
Name
Owned For
Owner Type
Purchase Details
Closed on
Aug 12, 2021
Sold by
Hunnicutt Robert P
Bought by
Barnes Rick H and Barnes Sandy
Current Estimated Value
Home Financials for this Owner
Home Financials are based on the most recent Mortgage that was taken out on this home.
Original Mortgage
$295,727
Outstanding Balance
$18,053
Interest Rate
2.8%
Mortgage Type
New Conventional
Estimated Equity
$402,701
Purchase Details
Closed on
Sep 6, 2002
Sold by
Wall William M
Bought by
Hunnicutt Robert P
Purchase Details
Closed on
Aug 7, 2000
Sold by
Showers Michael S
Bought by
Wall William M
Purchase Details
Closed on
Feb 3, 1998
Sold by
Gayton Dr G L
Bought by
Showers Michael S
Purchase Details
Closed on
Jul 24, 1997
Sold by
Dillard Joseph W
Bought by
Gayton Dr G L
Purchase Details
Closed on
May 1, 1966
Bought by
Dillard Joseph W
Create a Home Valuation Report for This Property
The Home Valuation Report is an in-depth analysis detailing your home's value as well as a comparison with similar homes in the area
Home Values in the Area
Average Home Value in this Area
Purchase History
| Date | Buyer | Sale Price | Title Company |
|---|---|---|---|
| Barnes Rick H | $300,000 | -- | |
| Hunnicutt Robert P | $150,000 | -- | |
| Wall William M | $115,000 | -- | |
| Showers Michael S | $90,000 | -- | |
| Gayton Dr G L | $80,500 | -- | |
| Dillard Joseph W | -- | -- |
Source: Public Records
Mortgage History
| Date | Status | Borrower | Loan Amount |
|---|---|---|---|
| Open | Barnes Rick H | $295,727 |
Source: Public Records
Tax History Compared to Growth
Tax History
| Year | Tax Paid | Tax Assessment Tax Assessment Total Assessment is a certain percentage of the fair market value that is determined by local assessors to be the total taxable value of land and additions on the property. | Land | Improvement |
|---|---|---|---|---|
| 2024 | $2,716 | $72,120 | $32,000 | $40,120 |
| 2023 | $2,644 | $72,120 | $32,000 | $40,120 |
| 2022 | $2,644 | $72,120 | $32,000 | $40,120 |
| 2021 | $2,649 | $72,120 | $32,000 | $40,120 |
| 2020 | $2,726 | $72,120 | $32,000 | $40,120 |
| 2019 | $2,658 | $72,120 | $32,000 | $40,120 |
| 2018 | $2,658 | $72,120 | $32,000 | $40,120 |
| 2017 | $2,658 | $72,120 | $32,000 | $40,120 |
| 2016 | $2,660 | $72,120 | $32,000 | $40,120 |
| 2015 | -- | $71,840 | $29,200 | $42,640 |
| 2014 | $2,701 | $74,884 | $29,200 | $45,684 |
| 2013 | -- | $74,884 | $29,200 | $45,684 |
Source: Public Records
Map
Nearby Homes
- 170D Cantey Dr
- 152 Cantey Dr
- 252 N Spring Creek Cir
- 108 N Spring Creek Cir
- 151 Gary Brewer Rd
- 114 Water Front Rd
- 115 Cypress Ln
- 0 N Spring Creek Cir
- 376 N Spring Creek Cir
- TBD N Spring Creek Cir
- 101 Rose Ln
- 286 Cannon Branch Rd
- 100 Valhalla
- 244 Cannon Branch Rd
- 110 N Valhalla Ln Unit 5
- 110 N Valhalla Ln
- 115 N Valhalla Ln
- 117 N Valhalla Ln
- 154 Cannon Branch Rd
- Lot # 18 Cannon Branch Rd
- 197 Tommy Warren Dr
- 203 Tommy Warren Dr
- 193 Tommy Warren Dr
- 191 Tommy Warren Dr
- 205 Tommy Warren Dr
- 189 Tommy Warren Dr
- 211 Tommy Warren Dr
- 122 Tom Hollomn Rd
- 183 Tommy Warren Dr
- 124 Tom Hollomn Rd
- 120 Tom Hollomn Rd
- 213 Tommy Warren Dr
- 118 Rd
- 179 Tommy Warren Dr
- 180 Tommy Warren Dr
- 217 Tommy Warren Rd
- 218 Tommy Warren Dr
- 110 Tom Hollomn Rd
- 175 Tommy Warren Dr
- 171 Tommy Warren Dr