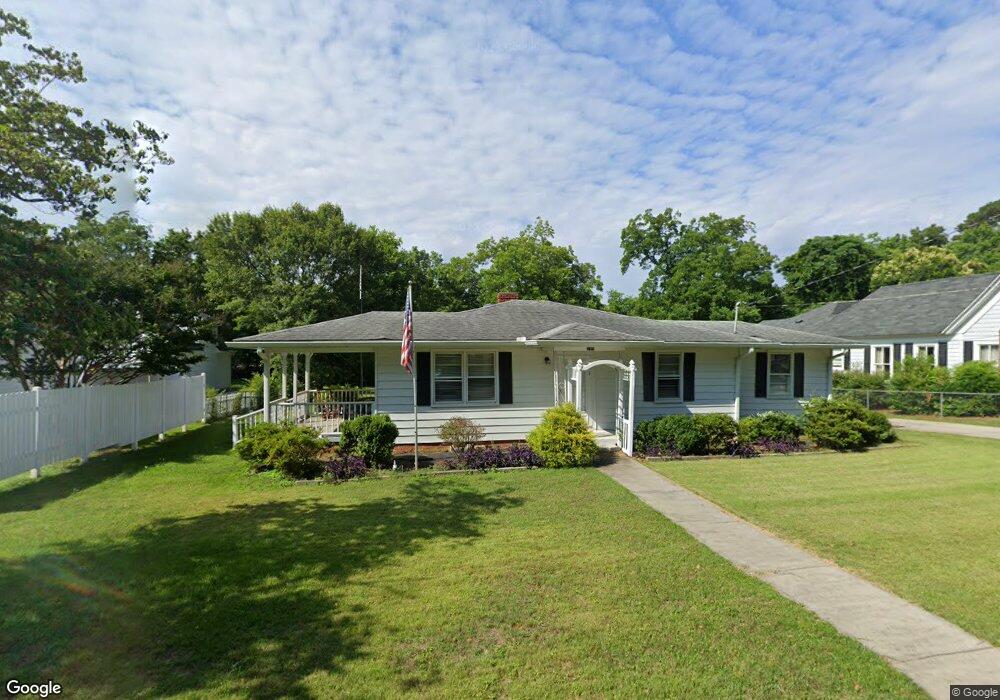
195 W Main St Rutledge, GA 30663
Estimated Value: $280,295 - $371,000
4
Beds
2
Baths
1,556
Sq Ft
$207/Sq Ft
Est. Value
About This Home
This home is located at 195 W Main St, Rutledge, GA 30663 and is currently estimated at $321,324, approximately $206 per square foot. 195 W Main St is a home located in Morgan County with nearby schools including Morgan County Primary School, Morgan County Elementary School, and Morgan County Middle School.
Ownership History
Date
Name
Owned For
Owner Type
Purchase Details
Closed on
Oct 19, 2022
Sold by
Smith Melvin C
Bought by
Smith Patricia A Stone
Current Estimated Value
Purchase Details
Closed on
Jan 19, 2017
Sold by
Okelley William David
Bought by
Smith Melvin C and Smith Patricia A
Home Financials for this Owner
Home Financials are based on the most recent Mortgage that was taken out on this home.
Original Mortgage
$149,785
Interest Rate
4.3%
Mortgage Type
VA
Purchase Details
Closed on
May 9, 2012
Sold by
Okelley William David
Bought by
Okelley William David and Okelley Robyn Watters
Purchase Details
Closed on
Sep 23, 2008
Sold by
Parkman Jolene
Bought by
Okelly William
Purchase Details
Closed on
Jul 17, 2008
Sold by
Brown Helen Margaret
Bought by
Brown Helen Margaret
Purchase Details
Closed on
Oct 5, 2006
Sold by
Brown Collins Helen M
Bought by
Brown Helen Margaret N and Brown K
Create a Home Valuation Report for This Property
The Home Valuation Report is an in-depth analysis detailing your home's value as well as a comparison with similar homes in the area
Home Values in the Area
Average Home Value in this Area
Purchase History
| Date | Buyer | Sale Price | Title Company |
|---|---|---|---|
| Smith Patricia A Stone | -- | -- | |
| Smith Melvin C | $145,000 | -- | |
| Okelley William David | -- | -- | |
| Okelly William | -- | -- | |
| Brown Helen Margaret | -- | -- | |
| Brown Helen Margaret N | -- | -- |
Source: Public Records
Mortgage History
| Date | Status | Borrower | Loan Amount |
|---|---|---|---|
| Previous Owner | Smith Melvin C | $149,785 |
Source: Public Records
Tax History Compared to Growth
Tax History
| Year | Tax Paid | Tax Assessment Tax Assessment Total Assessment is a certain percentage of the fair market value that is determined by local assessors to be the total taxable value of land and additions on the property. | Land | Improvement |
|---|---|---|---|---|
| 2024 | $1,669 | $81,280 | $15,200 | $66,080 |
| 2023 | $1,511 | $73,366 | $13,600 | $59,766 |
| 2022 | $1,491 | $70,446 | $13,600 | $56,846 |
| 2021 | $1,269 | $62,244 | $8,000 | $54,244 |
| 2020 | $1,226 | $60,244 | $6,000 | $54,244 |
| 2019 | $1,244 | $60,244 | $6,000 | $54,244 |
| 2018 | $1,322 | $56,374 | $6,000 | $50,374 |
| 2017 | $1,497 | $51,090 | $6,000 | $45,090 |
| 2016 | $438 | $29,896 | $6,000 | $23,896 |
| 2015 | $394 | $28,248 | $4,000 | $24,248 |
| 2014 | $200 | $22,316 | $4,000 | $18,316 |
| 2013 | -- | $18,560 | $4,000 | $14,560 |
Source: Public Records
Map
Nearby Homes
- 224 Hollis St
- 306 W Main St
- 5761B W Dixie Hwy
- 0 Hawkins Academy Rd Unit 10561655
- 5761 W Dixie Hwy
- 5521 Atlanta Hwy
- 5761B Dixie Hwy
- 1971 Centennial Rd
- 2070 Walter Shepherd Rd
- 1310 Chilton Woods Rd
- 1051 Lake Rutledge Rd
- 0 W Dixie Hwy Unit 10499573
- 1151 Fears Rd
- 1120 Rawlings Dr
- 4350 Atlanta Hwy
- 5187 Parkview Rd
- 201 W Main St
- 189 W Main St
- 188 W Main St Unit LOT 2
- 188 W Main St
- 202 W Main St
- 202 W Main St Unit 202
- 209 W Main St
- 194 W Main St Unit PLUS OFF-LAKE LOT
- 179 W Main St
- 179 W Main St
- 215 W Main St
- 214 W Main St
- 209 W Dixie Hwy
- 161 W Main St
- 230 W Main St
- 231 W Main St
- 199 Mcdonough St
- 195 W Dixie Hwy
- 256 Williams St
- 233 W Dixie Hwy