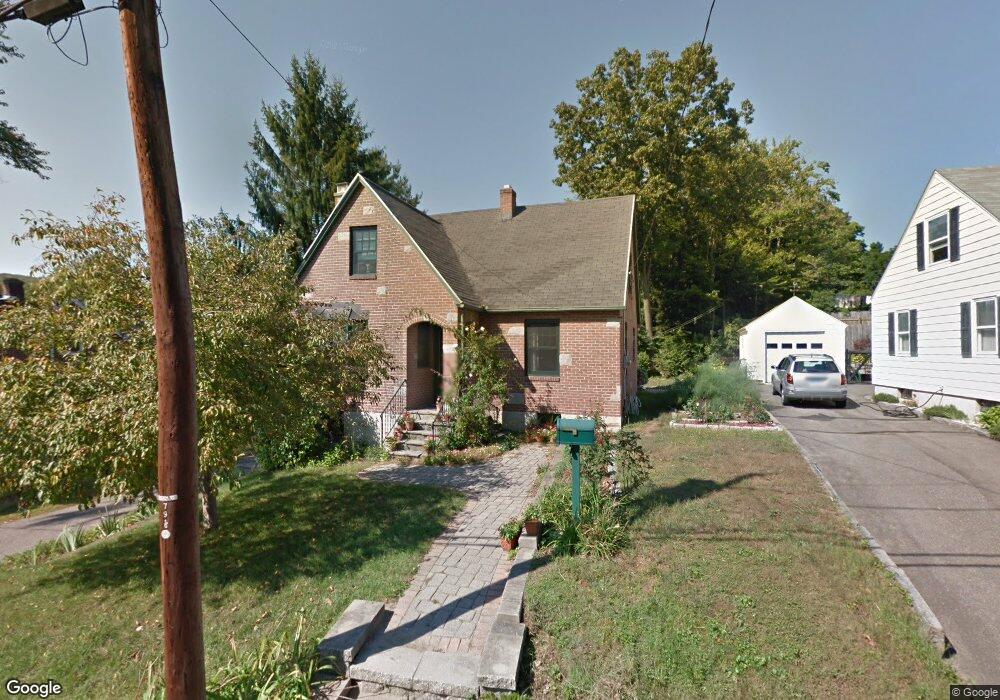
195 Wadhams Ave Torrington, CT 06790
Estimated Value: $296,214 - $343,000
3
Beds
2
Baths
1,471
Sq Ft
$214/Sq Ft
Est. Value
About This Home
This home is located at 195 Wadhams Ave, Torrington, CT 06790 and is currently estimated at $315,304, approximately $214 per square foot. 195 Wadhams Ave is a home located in Litchfield County with nearby schools including Torrington Middle School, Torrington High School, and St. John Paul the Great Academy.
Ownership History
Date
Name
Owned For
Owner Type
Purchase Details
Closed on
Aug 3, 1992
Sold by
Star Semiconductor
Bought by
Odell Michael R and Arsego Natalie A
Current Estimated Value
Home Financials for this Owner
Home Financials are based on the most recent Mortgage that was taken out on this home.
Original Mortgage
$120,550
Interest Rate
8.46%
Mortgage Type
Unknown
Create a Home Valuation Report for This Property
The Home Valuation Report is an in-depth analysis detailing your home's value as well as a comparison with similar homes in the area
Home Values in the Area
Average Home Value in this Area
Purchase History
| Date | Buyer | Sale Price | Title Company |
|---|---|---|---|
| Odell Michael R | $121,000 | -- | |
| Star Semiconductor | $140,000 | -- |
Source: Public Records
Mortgage History
| Date | Status | Borrower | Loan Amount |
|---|---|---|---|
| Open | Star Semiconductor | $63,000 | |
| Closed | Star Semiconductor | $89,700 | |
| Closed | Star Semiconductor | $119,050 | |
| Closed | Star Semiconductor | $120,550 |
Source: Public Records
Tax History
| Year | Tax Paid | Tax Assessment Tax Assessment Total Assessment is a certain percentage of the fair market value that is determined by local assessors to be the total taxable value of land and additions on the property. | Land | Improvement |
|---|---|---|---|---|
| 2025 | $6,971 | $181,300 | $30,240 | $151,060 |
| 2024 | $4,574 | $95,350 | $30,250 | $65,100 |
| 2023 | $4,573 | $95,350 | $30,250 | $65,100 |
| 2022 | $4,495 | $95,350 | $30,250 | $65,100 |
| 2021 | $4,402 | $95,350 | $30,250 | $65,100 |
| 2020 | $4,402 | $95,350 | $30,250 | $65,100 |
| 2019 | $4,093 | $88,640 | $33,600 | $55,040 |
| 2018 | $4,093 | $88,640 | $33,600 | $55,040 |
| 2017 | $4,055 | $88,640 | $33,600 | $55,040 |
| 2016 | $4,055 | $88,640 | $33,600 | $55,040 |
| 2015 | $4,055 | $88,640 | $33,600 | $55,040 |
| 2014 | $4,211 | $115,940 | $44,600 | $71,340 |
Source: Public Records
Map
Nearby Homes
- 839 Main St Unit 56
- 839 Main St Unit 98
- 839 Main St Unit 78
- 839 Main St Unit 104
- 38 Surrey Ln Unit 38
- 19 Surrey Ln Unit 19C
- 27 Surrey Ln Unit d27
- 0 Queens Rd
- 682 Main St
- 71 Doman Dr
- 23 Benham St
- 75 Hunter Ct Unit 75
- 79 Hunter Ct
- 277 Brightwood Ave
- 0 Stoneridge Dr
- 00 Winthrop St & E Elm St
- 67 Amherst St
- 130 N Elm St
- 0 Red Mountain Ave
- 279 E Elm St
Your Personal Tour Guide
Ask me questions while you tour the home.