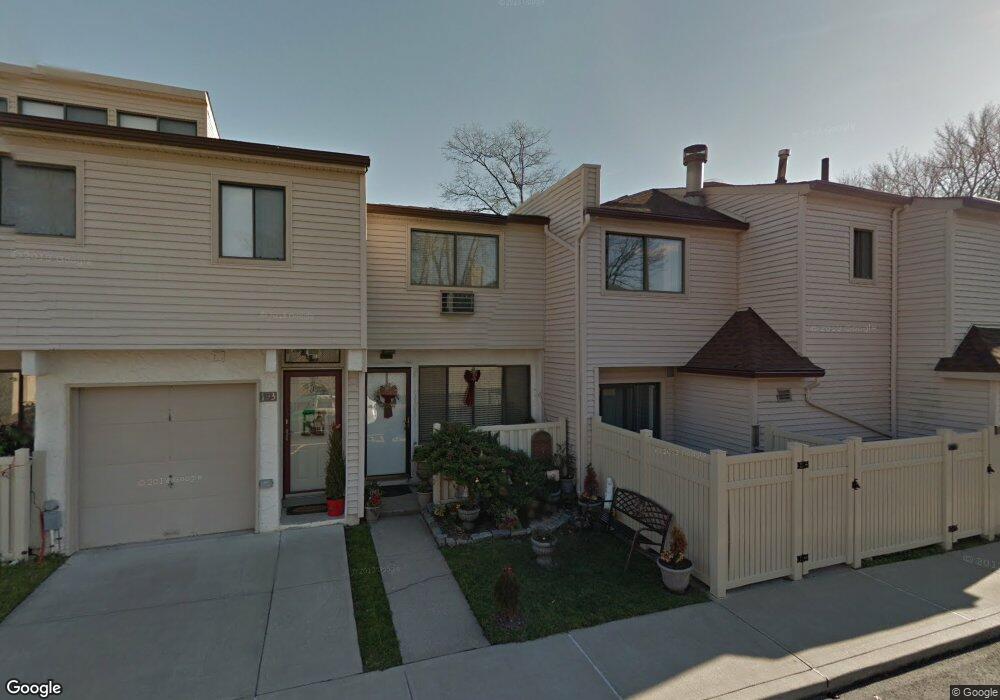
195 Winding Woods Loop Unit 79 Staten Island, NY 10307
Tottenville NeighborhoodEstimated Value: $356,000 - $456,000
1
Bed
2
Baths
768
Sq Ft
$518/Sq Ft
Est. Value
About This Home
This home is located at 195 Winding Woods Loop Unit 79, Staten Island, NY 10307 and is currently estimated at $397,512, approximately $517 per square foot. 195 Winding Woods Loop Unit 79 is a home located in Richmond County with nearby schools including P.S. 6 Cpl Allan F Kivlehan School, Is 34 Tottenville, and Tottenville High School.
Ownership History
Date
Name
Owned For
Owner Type
Purchase Details
Closed on
Sep 14, 2020
Sold by
Rappa Anna M
Bought by
Zazulka Susan
Current Estimated Value
Home Financials for this Owner
Home Financials are based on the most recent Mortgage that was taken out on this home.
Original Mortgage
$260,000
Outstanding Balance
$230,733
Interest Rate
2.9%
Mortgage Type
New Conventional
Estimated Equity
$166,779
Purchase Details
Closed on
Nov 17, 2010
Sold by
Padovano Maria and Padovao Maria
Bought by
Rappa Anna M
Purchase Details
Closed on
Aug 9, 2010
Sold by
Nyhus Catherine and The Estate Of Roy K Nyhus
Bought by
Padovao Maria
Purchase Details
Closed on
Apr 22, 1998
Sold by
Loiacono Vincent and Loiacono Emily
Bought by
Nyhus Roy K
Home Financials for this Owner
Home Financials are based on the most recent Mortgage that was taken out on this home.
Original Mortgage
$68,400
Interest Rate
7.03%
Create a Home Valuation Report for This Property
The Home Valuation Report is an in-depth analysis detailing your home's value as well as a comparison with similar homes in the area
Home Values in the Area
Average Home Value in this Area
Purchase History
| Date | Buyer | Sale Price | Title Company |
|---|---|---|---|
| Zazulka Susan | $325,000 | Ridge Abstract Corp | |
| Rappa Anna M | -- | None Available | |
| Padovao Maria | $205,000 | Old Republic National Title | |
| Nyhus Roy K | $72,000 | Fidelity National Title Ins |
Source: Public Records
Mortgage History
| Date | Status | Borrower | Loan Amount |
|---|---|---|---|
| Open | Zazulka Susan | $260,000 | |
| Previous Owner | Nyhus Roy K | $68,400 |
Source: Public Records
Tax History Compared to Growth
Tax History
| Year | Tax Paid | Tax Assessment Tax Assessment Total Assessment is a certain percentage of the fair market value that is determined by local assessors to be the total taxable value of land and additions on the property. | Land | Improvement |
|---|---|---|---|---|
| 2025 | $2,726 | $19,034 | $1,351 | $17,683 |
| 2024 | $2,726 | $19,221 | $1,338 | $17,883 |
| 2023 | $2,736 | $13,471 | $1,246 | $12,225 |
| 2022 | $2,537 | $18,218 | $1,895 | $16,323 |
| 2021 | $2,523 | $15,950 | $1,895 | $14,055 |
| 2020 | $901 | $15,393 | $1,895 | $13,498 |
| 2019 | $1,113 | $14,357 | $1,895 | $12,462 |
| 2018 | $847 | $11,226 | $1,586 | $9,640 |
| 2017 | $589 | $10,591 | $1,626 | $8,965 |
| 2016 | $689 | $9,992 | $1,569 | $8,423 |
| 2015 | $615 | $9,427 | $1,895 | $7,532 |
| 2014 | $615 | $9,594 | $1,895 | $7,699 |
Source: Public Records
Map
Nearby Homes
- 175 Winding Woods Loop Unit 69
- 108 Surfside Plaza Unit 87
- 320 Sprague Ave
- 659 Rockaway St Unit 661
- 61 Billop Ave
- 539 Yetman Ave
- 667 Yetman Ave
- 382 Manhattan St
- 443 Manhattan St
- 342 Chelsea St
- 284 Chelsea St
- 329 George St
- 411 Yetman Ave
- 14 Ottavio Promenade
- 403 Yetman Ave
- 43 Ottavio Promenade
- 40 Dintree Ln
- 30 Paradise Place
- 64 Ottavio Promenade
- 215 Clearmont Ave
- 122 Surfside Plaza Unit 94
- 106 Surfside Plaza Unit 86
- 205 Winding Woods Loop Unit 83
- 189 Winding Woods Loop Unit 76
- 187 Winding Woods Loop Unit 75
- 179 Winding Woods Loop Unit 71
- 177 Winding Woods Loop Unit 70
- 382 Sprague Ave Unit 62
- 105 Surfside Plaza Unit 48
- 376 Sprague Ave Unit 45
- 223-233 Winding Woods Loop Unit 54
- 104 Surfside Plaza Unit 85
- 102 Surfside Plaza Unit 84
- 203 Winding Woods Loop Unit 80
- 193 Winding Woods Loop Unit 78
- 112 Surfside Plaza Unit 7860-7502
- 112 Surfside Plaza Unit 89
- 201 Winding Woods Loop Unit 81
- 191 Winding Woods Loop Unit 77
- 189 Windingwood Loop