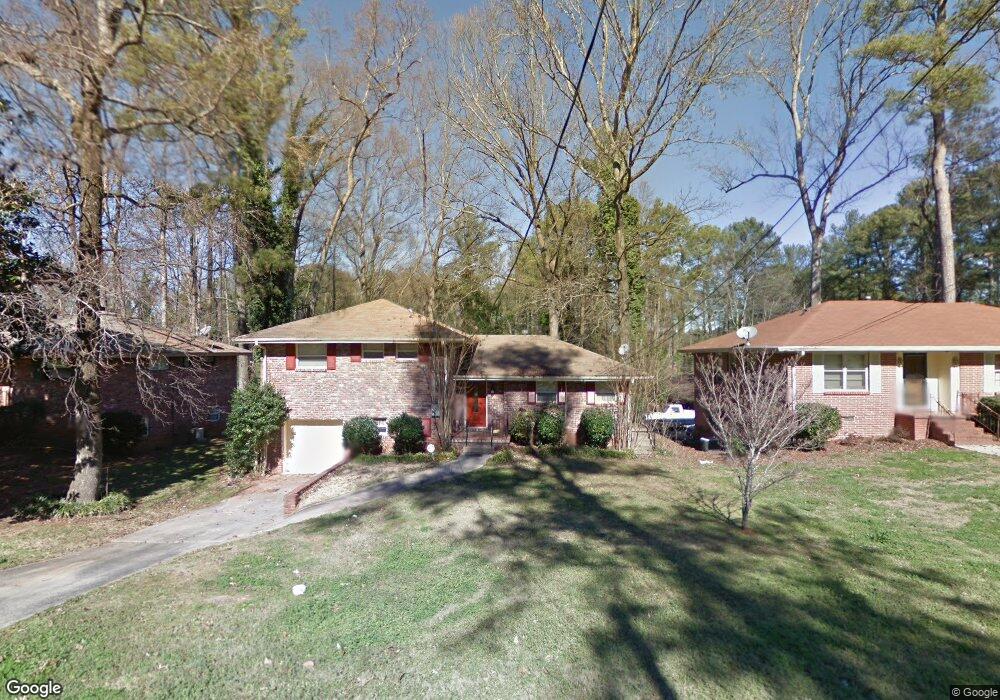
1950 Farris Dr Unit 1950 Decatur, GA 30032
Estimated Value: $208,000 - $293,000
4
Beds
3
Baths
1,756
Sq Ft
$145/Sq Ft
Est. Value
About This Home
This home is located at 1950 Farris Dr Unit 1950, Decatur, GA 30032 and is currently estimated at $255,108, approximately $145 per square foot. 1950 Farris Dr Unit 1950 is a home located in DeKalb County with nearby schools including Toney Elementary School, Columbia Middle School, and Columbia High School.
Ownership History
Date
Name
Owned For
Owner Type
Purchase Details
Closed on
Apr 7, 2008
Sold by
Bank Of America Na
Bought by
Vasquez Andres and Hernandez Maria
Current Estimated Value
Purchase Details
Closed on
Jul 3, 2007
Sold by
Pearson Tracey
Bought by
Bank Of America Na
Purchase Details
Closed on
Dec 14, 2000
Sold by
Freemont Investment & Loan
Bought by
Pearson Tracey L
Home Financials for this Owner
Home Financials are based on the most recent Mortgage that was taken out on this home.
Original Mortgage
$94,355
Interest Rate
7.72%
Mortgage Type
New Conventional
Purchase Details
Closed on
Feb 2, 1999
Sold by
Newton Eleanor R
Bought by
King Timothy
Home Financials for this Owner
Home Financials are based on the most recent Mortgage that was taken out on this home.
Original Mortgage
$94,350
Interest Rate
11%
Mortgage Type
New Conventional
Create a Home Valuation Report for This Property
The Home Valuation Report is an in-depth analysis detailing your home's value as well as a comparison with similar homes in the area
Home Values in the Area
Average Home Value in this Area
Purchase History
| Date | Buyer | Sale Price | Title Company |
|---|---|---|---|
| Vasquez Andres | $85,000 | -- | |
| Vasquez Andres | $85,000 | -- | |
| Bank Of America Na | $16,945 | -- | |
| Bank Of America Na | $16,945 | -- | |
| Pearson Tracey L | $94,400 | -- | |
| Pearson Tracey L | $94,400 | -- | |
| King Timothy | $111,000 | -- | |
| King Timothy | $111,000 | -- |
Source: Public Records
Mortgage History
| Date | Status | Borrower | Loan Amount |
|---|---|---|---|
| Previous Owner | Pearson Tracey L | $94,355 | |
| Previous Owner | King Timothy | $94,350 |
Source: Public Records
Tax History Compared to Growth
Tax History
| Year | Tax Paid | Tax Assessment Tax Assessment Total Assessment is a certain percentage of the fair market value that is determined by local assessors to be the total taxable value of land and additions on the property. | Land | Improvement |
|---|---|---|---|---|
| 2025 | $4,418 | $90,680 | $24,560 | $66,120 |
| 2024 | $4,050 | $82,320 | $24,560 | $57,760 |
| 2023 | $4,050 | $87,160 | $24,560 | $62,600 |
| 2022 | $3,003 | $60,600 | $14,040 | $46,560 |
| 2021 | $3,238 | $65,960 | $14,040 | $51,920 |
| 2020 | $2,787 | $55,680 | $12,000 | $43,680 |
| 2019 | $2,783 | $55,600 | $12,000 | $43,600 |
| 2018 | $1,825 | $43,720 | $12,000 | $31,720 |
| 2017 | $2,010 | $36,720 | $3,200 | $33,520 |
| 2016 | $1,617 | $28,840 | $3,200 | $25,640 |
| 2014 | $995 | $14,400 | $3,000 | $11,400 |
Source: Public Records
Map
Nearby Homes
- 1857 Derrill Dr
- 3815 Glenwood Rd
- 1884 Derrill Dr
- 1911 Rosewood Rd
- 1923 Rosewood Rd
- 1879 Rosewood Rd
- 1932 Rosewood Rd
- 1882 Rosewood Rd
- 1841 Glendale Dr
- 1852 Shamrock Dr
- 1846 Shamrock Dr
- 2361 Lynn Lris Dr
- 3260 Glenco Dr
- 1968 Rosewood Rd
- 1819 Rosewood Rd
- 3235 Glenwood Rd
- 1764 Thomas Terrace
- 1973 Glendale Dr
- 1761 Derrill Dr