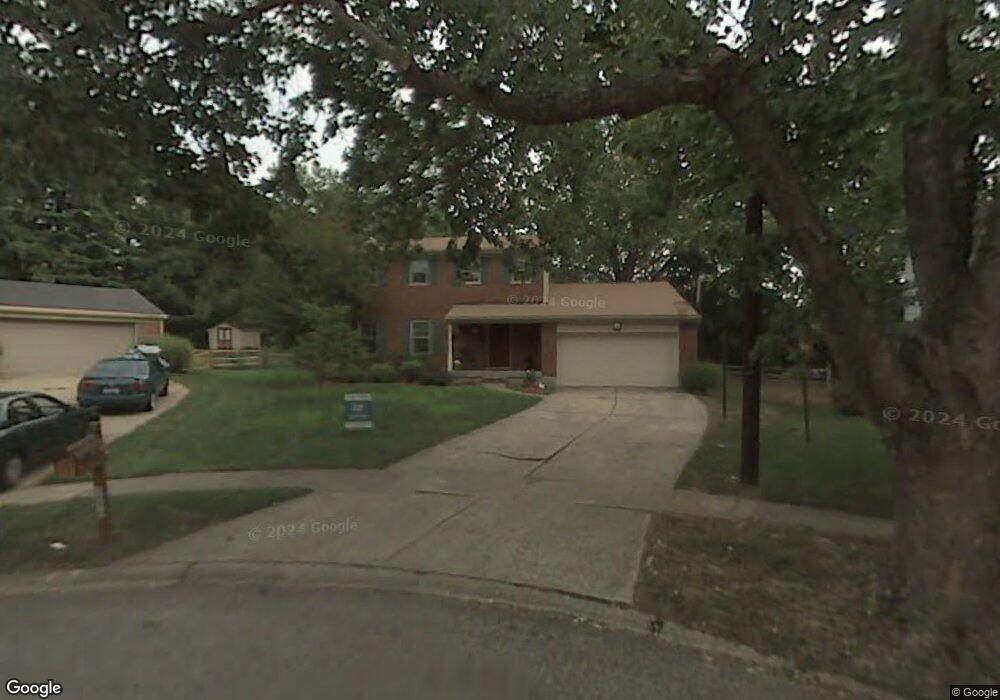
1950 Finsbury Ct Cincinnati, OH 45230
Sherwood NeighborhoodEstimated Value: $343,682 - $363,000
3
Beds
3
Baths
1,755
Sq Ft
$202/Sq Ft
Est. Value
About This Home
This home is located at 1950 Finsbury Ct, Cincinnati, OH 45230 and is currently estimated at $354,671, approximately $202 per square foot. 1950 Finsbury Ct is a home located in Hamilton County with nearby schools including Sherwood Elementary School, Nagel Middle School, and Turpin High School.
Ownership History
Date
Name
Owned For
Owner Type
Purchase Details
Closed on
Sep 18, 2008
Sold by
Fennell Linda Diane and Gillispie Linda D
Bought by
Buckley Jennifer
Current Estimated Value
Home Financials for this Owner
Home Financials are based on the most recent Mortgage that was taken out on this home.
Original Mortgage
$131,250
Outstanding Balance
$87,508
Interest Rate
6.57%
Mortgage Type
New Conventional
Estimated Equity
$267,163
Create a Home Valuation Report for This Property
The Home Valuation Report is an in-depth analysis detailing your home's value as well as a comparison with similar homes in the area
Home Values in the Area
Average Home Value in this Area
Purchase History
| Date | Buyer | Sale Price | Title Company |
|---|---|---|---|
| Buckley Jennifer | $175,000 | Stonebridge Land Title Agenc |
Source: Public Records
Mortgage History
| Date | Status | Borrower | Loan Amount |
|---|---|---|---|
| Open | Buckley Jennifer | $131,250 |
Source: Public Records
Tax History Compared to Growth
Tax History
| Year | Tax Paid | Tax Assessment Tax Assessment Total Assessment is a certain percentage of the fair market value that is determined by local assessors to be the total taxable value of land and additions on the property. | Land | Improvement |
|---|---|---|---|---|
| 2024 | $5,877 | $96,793 | $15,330 | $81,463 |
| 2023 | $5,590 | $96,793 | $15,330 | $81,463 |
| 2022 | $3,948 | $60,855 | $10,283 | $50,572 |
| 2021 | $3,854 | $60,855 | $10,283 | $50,572 |
| 2020 | $3,899 | $60,855 | $10,283 | $50,572 |
| 2019 | $3,800 | $53,855 | $9,100 | $44,755 |
| 2018 | $3,560 | $53,855 | $9,100 | $44,755 |
| 2017 | $3,357 | $53,855 | $9,100 | $44,755 |
| 2016 | $3,390 | $53,120 | $9,639 | $43,481 |
| 2015 | $3,292 | $53,120 | $9,639 | $43,481 |
| 2014 | $3,294 | $53,120 | $9,639 | $43,481 |
| 2013 | $3,054 | $52,077 | $9,450 | $42,627 |
Source: Public Records
Map
Nearby Homes
- 1983 Finsbury Ct
- 7026 Queensway Ln
- 7325 State Rd
- 7216 Bridges Rd
- 1731 Rudyard Ln
- 1659 Robinway Dr
- 7027 Paddison Rd
- 1679 Locksley Dr
- 7053 Paddison Rd
- 1452 Verdale Dr
- 7114 Paddison Rd
- 7080 Petri Dr
- 7179 Paddison Rd
- 1714 Emerald Glade Ln Unit 5E
- 1395 Tallberry Dr
- 1391 Collinsdale Ave
- 1844 Lindsey Ln
- 2193 Flaxen Ct
- 2201 Candlemaker Dr
- 7516 Kingston View Ct
- 1958 Finsbury Ct
- 1951 Finsbury Ct
- 1963 Flintshire Ct
- 1964 Finsbury Ct
- 1957 Flintshire Ct
- 1957 Finsbury Ct
- 1963 Finsbury Ct
- 1969 Flintshire Ct
- 1970 Finsbury Ct
- 1969 Finsbury Ct
- 1977 Flintshire Ct
- 1948 Robinway Dr
- 1954 Robinway Dr
- 1942 Robinway Dr
- 1978 Finsbury Ct
- 1958 Robinway Dr
- 1956 Flintshire Ct
- 1938 Robinway Dr
- 1964 Robinway Dr
- 1977 Finsbury Ct