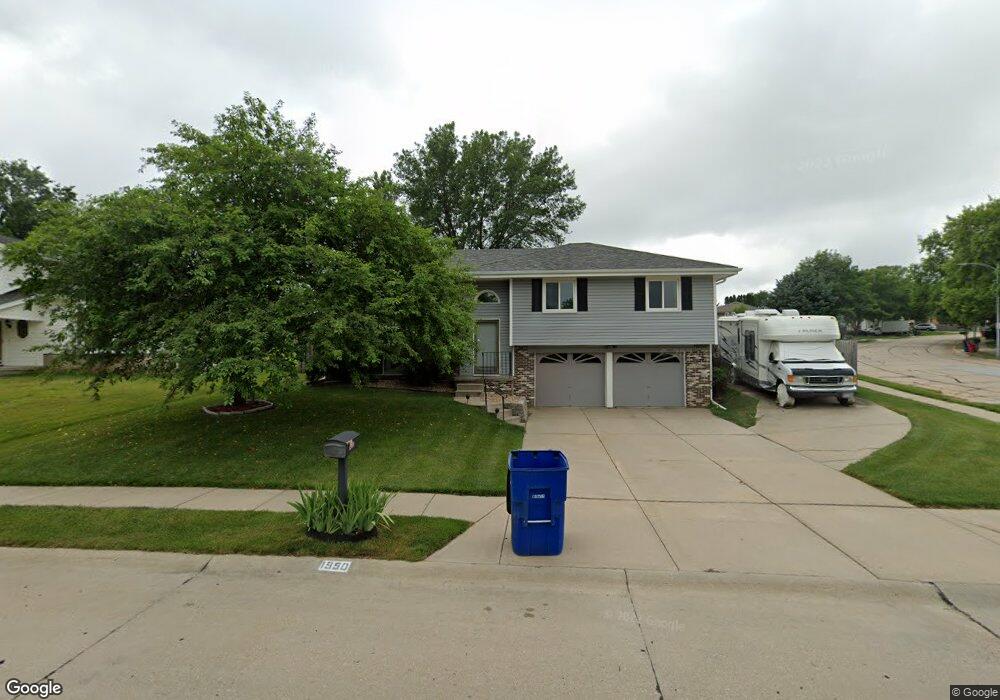
1950 Kingston Cir Papillion, NE 68046
Estimated Value: $299,960 - $318,000
3
Beds
4
Baths
1,532
Sq Ft
$201/Sq Ft
Est. Value
About This Home
This home is located at 1950 Kingston Cir, Papillion, NE 68046 and is currently estimated at $307,740, approximately $200 per square foot. 1950 Kingston Cir is a home located in Sarpy County with nearby schools including Walnut Creek Elementary School, Papillion Middle School, and Papillion La Vista South High School.
Ownership History
Date
Name
Owned For
Owner Type
Purchase Details
Closed on
Aug 17, 2010
Sold by
Guffey Kristi L
Bought by
Guffey Maurice Mo H
Current Estimated Value
Purchase Details
Closed on
May 21, 2003
Sold by
Sobczyk Paul J and Sobczyk Kimberly A
Bought by
Guffey Maurice H and Guffey Kristi L
Home Financials for this Owner
Home Financials are based on the most recent Mortgage that was taken out on this home.
Original Mortgage
$133,400
Outstanding Balance
$57,767
Interest Rate
5.74%
Estimated Equity
$249,973
Purchase Details
Closed on
Aug 11, 1999
Sold by
Graham Denise D and Kuehn Shane
Bought by
Sobczyk Paul J and Sobczyk Kimberly A
Home Financials for this Owner
Home Financials are based on the most recent Mortgage that was taken out on this home.
Original Mortgage
$96,000
Interest Rate
7.65%
Create a Home Valuation Report for This Property
The Home Valuation Report is an in-depth analysis detailing your home's value as well as a comparison with similar homes in the area
Home Values in the Area
Average Home Value in this Area
Purchase History
| Date | Buyer | Sale Price | Title Company |
|---|---|---|---|
| Guffey Maurice Mo H | -- | None Available | |
| Guffey Maurice H | $134,000 | -- | |
| Sobczyk Paul J | $120,000 | -- |
Source: Public Records
Mortgage History
| Date | Status | Borrower | Loan Amount |
|---|---|---|---|
| Open | Guffey Maurice H | $133,400 | |
| Previous Owner | Sobczyk Paul J | $96,000 |
Source: Public Records
Tax History Compared to Growth
Tax History
| Year | Tax Paid | Tax Assessment Tax Assessment Total Assessment is a certain percentage of the fair market value that is determined by local assessors to be the total taxable value of land and additions on the property. | Land | Improvement |
|---|---|---|---|---|
| 2025 | $3,500 | $269,980 | $41,000 | $228,980 |
| 2024 | $4,095 | $235,091 | $38,000 | $197,091 |
| 2023 | $4,095 | $217,503 | $36,000 | $181,503 |
| 2022 | $4,272 | $209,360 | $33,000 | $176,360 |
| 2021 | $4,110 | $197,410 | $31,000 | $166,410 |
| 2020 | $3,760 | $178,833 | $29,000 | $149,833 |
| 2019 | $3,657 | $174,018 | $29,000 | $145,018 |
| 2018 | $3,521 | $165,020 | $22,000 | $143,020 |
| 2017 | $3,248 | $152,229 | $22,000 | $130,229 |
| 2016 | $2,947 | $138,347 | $22,000 | $116,347 |
| 2015 | $2,928 | $137,865 | $22,000 | $115,865 |
| 2014 | $2,852 | $133,375 | $22,000 | $111,375 |
| 2012 | -- | $128,010 | $22,000 | $106,010 |
Source: Public Records
Map
Nearby Homes
- 501 Kent Dr
- 701 Fenwick St
- 2105 Marilyn Dr
- 12001 S 90th St
- 2415 Corn Dr
- 2209 Corn Dr
- 812 Lake Tahoe Dr
- 10201 Cove Hollow Dr
- 2110 S Mineral Dr
- 814 Clearwater Dr
- 2208 S Mineral Dr
- Lot 65 Shadow Creek
- 8610 Legacy St
- 8716 Legacy St
- 8705 Legacy St
- 8709 Legacy St Unit Lot 69
- 8810 Legacy St
- 8713 Legacy St Unit Lot 70
- 8717 Legacy St Unit Lot 71
- 2010 Ridgeview Dr
- 1952 Kingston Cir
- 303 Windsor Dr
- 205 Windsor Dr
- 310 Windsor Dr
- 1954 Kingston Cir
- 305 Windsor Dr
- 320 Windsor Dr
- 230 Windsor Dr
- 1953 Kingston Cir
- 203 Windsor Dr
- 1956 Kingston Cir
- 307 Windsor Dr
- 1856 Kingston Cir
- 330 Windsor Dr
- 220 Windsor Dr
- 201 Windsor Dr
- 1958 Kingston Cir
- 309 Windsor Dr
- 1955 Kingston Cir
- 1853 Kingston Cir