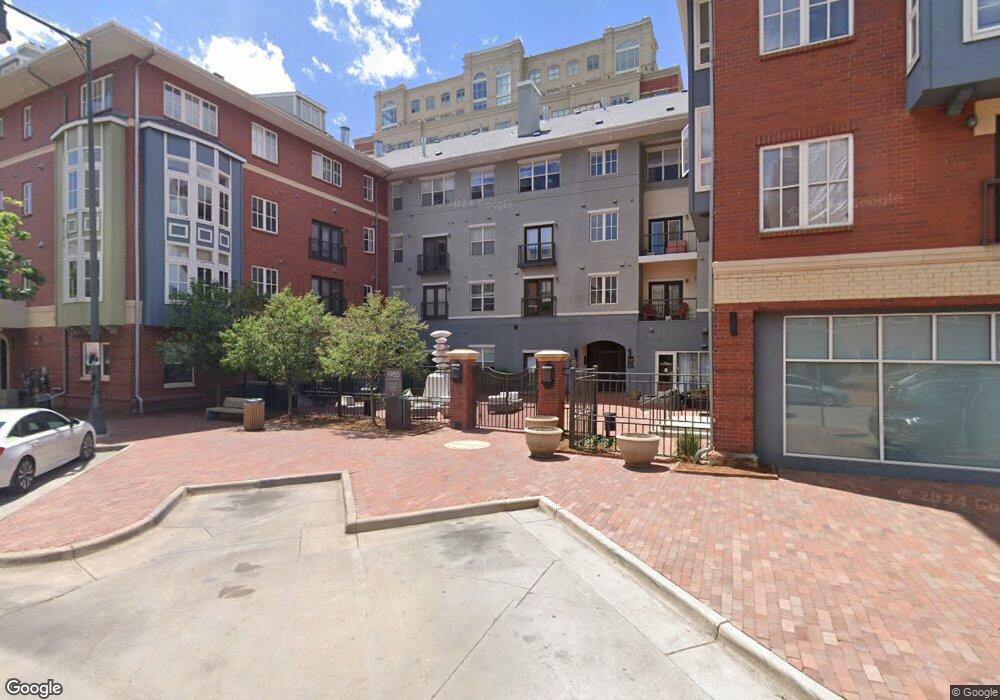
1950 Logan St Unit 1101 Denver, CO 80203
Uptown NeighborhoodEstimated Value: $456,383 - $556,000
2
Beds
2
Baths
991
Sq Ft
$494/Sq Ft
Est. Value
About This Home
This home is located at 1950 Logan St Unit 1101, Denver, CO 80203 and is currently estimated at $489,346, approximately $493 per square foot. 1950 Logan St Unit 1101 is a home located in Denver County with nearby schools including Whittier ECE-8 School, Cole Arts & Science Academy, and McAuliffe Manual Middle School.
Ownership History
Date
Name
Owned For
Owner Type
Purchase Details
Closed on
Mar 31, 2021
Sold by
Peterson Kristin L
Bought by
Wang Albert
Current Estimated Value
Home Financials for this Owner
Home Financials are based on the most recent Mortgage that was taken out on this home.
Original Mortgage
$456,000
Outstanding Balance
$411,048
Interest Rate
2.9%
Mortgage Type
New Conventional
Estimated Equity
$78,298
Purchase Details
Closed on
Aug 13, 2013
Sold by
Taylor Susan Jo
Bought by
Peterson Kristin L
Home Financials for this Owner
Home Financials are based on the most recent Mortgage that was taken out on this home.
Original Mortgage
$308,750
Interest Rate
4.53%
Mortgage Type
New Conventional
Purchase Details
Closed on
Apr 28, 2005
Sold by
Logan Llc
Bought by
Taylor Susan Jo
Home Financials for this Owner
Home Financials are based on the most recent Mortgage that was taken out on this home.
Original Mortgage
$243,200
Interest Rate
5%
Mortgage Type
Purchase Money Mortgage
Create a Home Valuation Report for This Property
The Home Valuation Report is an in-depth analysis detailing your home's value as well as a comparison with similar homes in the area
Home Values in the Area
Average Home Value in this Area
Purchase History
| Date | Buyer | Sale Price | Title Company |
|---|---|---|---|
| Wang Albert | $480,000 | First American Title | |
| Peterson Kristin L | $325,000 | First American | |
| Taylor Susan Jo | $304,000 | Chicago Title Co |
Source: Public Records
Mortgage History
| Date | Status | Borrower | Loan Amount |
|---|---|---|---|
| Open | Wang Albert | $456,000 | |
| Previous Owner | Peterson Kristin L | $308,750 | |
| Previous Owner | Taylor Susan Jo | $243,200 | |
| Closed | Taylor Susan Jo | $30,400 |
Source: Public Records
Tax History Compared to Growth
Tax History
| Year | Tax Paid | Tax Assessment Tax Assessment Total Assessment is a certain percentage of the fair market value that is determined by local assessors to be the total taxable value of land and additions on the property. | Land | Improvement |
|---|---|---|---|---|
| 2024 | $2,389 | $30,160 | $2,830 | $27,330 |
| 2023 | $2,337 | $30,160 | $2,830 | $27,330 |
| 2022 | $2,024 | $25,450 | $1,760 | $23,690 |
| 2021 | $2,024 | $26,180 | $1,810 | $24,370 |
| 2020 | $2,127 | $28,670 | $1,810 | $26,860 |
| 2019 | $2,068 | $28,670 | $1,810 | $26,860 |
| 2018 | $1,963 | $25,370 | $1,220 | $24,150 |
| 2017 | $1,957 | $25,370 | $1,220 | $24,150 |
| 2016 | $2,210 | $27,100 | $1,003 | $26,097 |
| 2015 | $2,117 | $27,100 | $1,003 | $26,097 |
| 2014 | $2,052 | $24,710 | $533 | $24,177 |
Source: Public Records
Map
Nearby Homes
- 1950 N Logan St
- 1950 N Logan St Unit 601
- 1950 N Logan St Unit 1013
- 1950 N Logan St Unit 1109
- 1950 N Logan St Unit 411
- 1975 N Grant St Unit 827
- 1975 N Grant St Unit 404
- 1975 N Grant St Unit 527
- 1975 N Grant St Unit 509
- 1975 N Grant St Unit 810
- 2200 Tremont Place Unit 5
- 1827 N Grant St Unit 800
- 1827 N Grant St Unit 604
- 1827 N Grant St Unit 502
- 100 Park Ave W Unit 1004
- 100 Park Ave W Unit 606
- 100 Park Ave W Unit 204
- 100 Park Ave W Unit 707
- 100 Park Ave W Unit 908
- 100 Park Ave W Unit 408
- 1950 Logan St Unit 1207
- 1950 Logan St Unit 1206
- 1950 Logan St Unit 1205
- 1950 Logan St Unit 1204
- 1950 Logan St Unit 1203
- 1950 Logan St Unit 1202
- 1950 Logan St Unit 1201
- 1950 Logan St Unit 1112
- 1950 Logan St Unit 1111
- 1950 Logan St Unit 1110
- 1950 Logan St Unit 1109
- 1950 Logan St
- 1950 Logan St
- 1950 Logan St Unit 1106
- 1950 Logan St Unit 1105
- 1950 Logan St Unit 1104
- 1950 Logan St Unit 1103
- 1950 Logan St Unit 1102
- 1950 Logan St Unit 108
- 1950 Logan St Unit 107