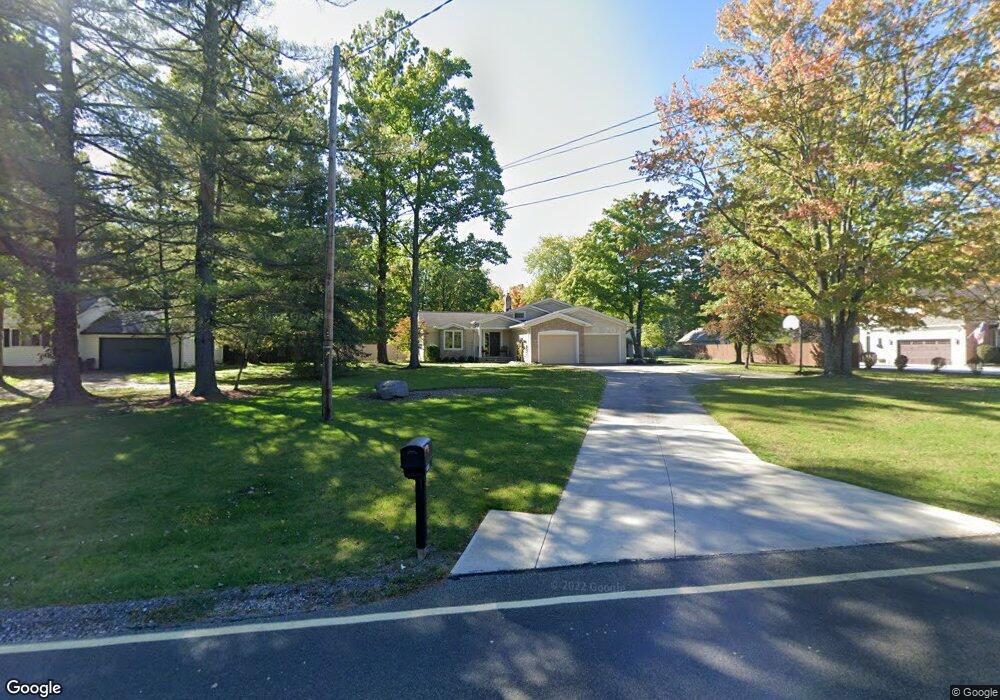
19500 Howe Rd Strongsville, OH 44136
Estimated Value: $304,903 - $341,000
3
Beds
2
Baths
1,536
Sq Ft
$211/Sq Ft
Est. Value
About This Home
This home is located at 19500 Howe Rd, Strongsville, OH 44136 and is currently estimated at $324,476, approximately $211 per square foot. 19500 Howe Rd is a home located in Cuyahoga County with nearby schools including Strongsville High School and Saint Ambrose Catholic School.
Ownership History
Date
Name
Owned For
Owner Type
Purchase Details
Closed on
Jul 16, 2002
Sold by
Mitchell Richard R and Mitchell Stacey S
Bought by
Kerr William R and Kerr Eileen M
Current Estimated Value
Home Financials for this Owner
Home Financials are based on the most recent Mortgage that was taken out on this home.
Original Mortgage
$120,000
Outstanding Balance
$51,159
Interest Rate
6.79%
Estimated Equity
$273,317
Purchase Details
Closed on
Jun 23, 1999
Sold by
Westbrook Robert W
Bought by
Mitchell Richard R and Mitchell Stacey S
Home Financials for this Owner
Home Financials are based on the most recent Mortgage that was taken out on this home.
Original Mortgage
$115,200
Interest Rate
7.15%
Purchase Details
Closed on
Apr 16, 1991
Sold by
Westbrook William J and Westbrook Marie
Bought by
Westbrook William J
Purchase Details
Closed on
Jan 1, 1975
Bought by
Westbrook William J and Westbrook Marie
Create a Home Valuation Report for This Property
The Home Valuation Report is an in-depth analysis detailing your home's value as well as a comparison with similar homes in the area
Home Values in the Area
Average Home Value in this Area
Purchase History
| Date | Buyer | Sale Price | Title Company |
|---|---|---|---|
| Kerr William R | $167,000 | Chicago Title Insurance Comp | |
| Mitchell Richard R | $129,000 | Midland Title Security Inc | |
| Westbrook William J | -- | -- | |
| Westbrook William J | -- | -- |
Source: Public Records
Mortgage History
| Date | Status | Borrower | Loan Amount |
|---|---|---|---|
| Open | Kerr William R | $120,000 | |
| Closed | Mitchell Richard R | $115,200 |
Source: Public Records
Tax History Compared to Growth
Tax History
| Year | Tax Paid | Tax Assessment Tax Assessment Total Assessment is a certain percentage of the fair market value that is determined by local assessors to be the total taxable value of land and additions on the property. | Land | Improvement |
|---|---|---|---|---|
| 2024 | $4,345 | $92,540 | $22,365 | $70,175 |
| 2023 | $4,463 | $71,230 | $21,000 | $50,230 |
| 2022 | $4,430 | $71,225 | $21,000 | $50,225 |
| 2021 | $4,395 | $71,230 | $21,000 | $50,230 |
| 2020 | $4,072 | $58,380 | $17,220 | $41,160 |
| 2019 | $3,953 | $166,800 | $49,200 | $117,600 |
| 2018 | $3,501 | $58,380 | $17,220 | $41,160 |
| 2017 | $3,479 | $52,400 | $15,540 | $36,860 |
| 2016 | $3,450 | $52,400 | $15,540 | $36,860 |
| 2015 | $3,499 | $52,400 | $15,540 | $36,860 |
| 2014 | $3,499 | $52,400 | $15,540 | $36,860 |
Source: Public Records
Map
Nearby Homes
- 15772 Boston Rd
- 15604-REAR Boston Rd
- 19694 Benbow Rd
- 16711 Beech Cir
- 19740 Benbow Rd
- 97 Weathervane Ln
- 15188 Trails Landing
- 14985 Camden Cir
- 18229 Howe Rd
- 18987 Laurell Cir
- 17130 Golden Star Dr
- 19813 Cross Trail S
- 16486 S Red Rock Dr
- 17745 Brick Mill Run
- 19364 Ridgeline Ct
- 3137 Blackburn Ln
- 159 Sunflower Dr
- 291 Crestway Oval
- 106 Briarleigh Dr
- 17159 Turkey Meadow Ln