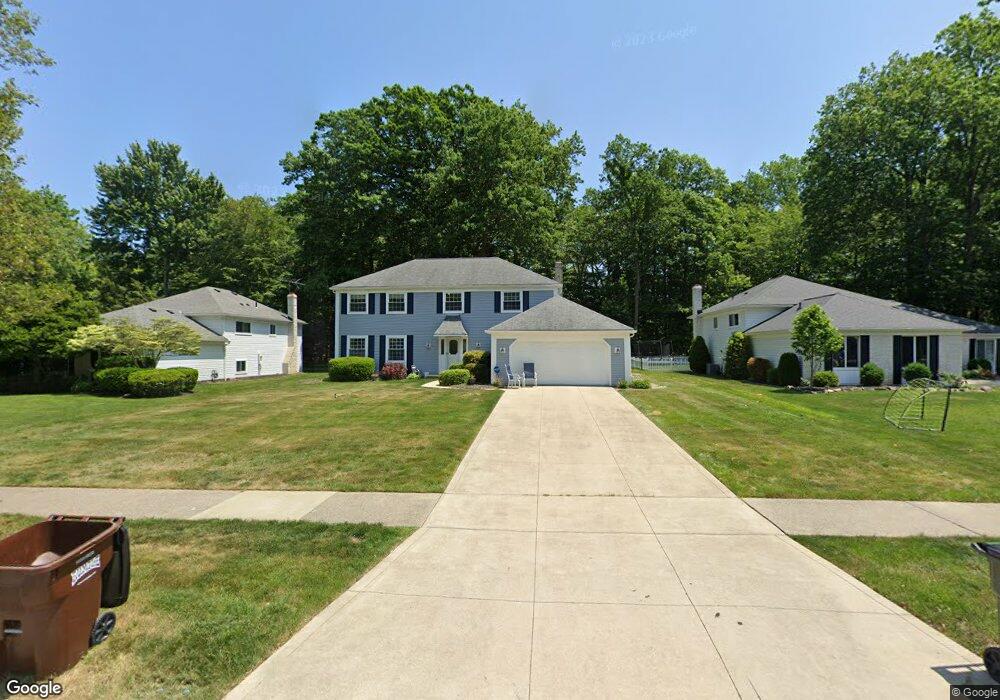
1951 Coes Post Run Westlake, OH 44145
Estimated Value: $451,000 - $533,000
4
Beds
3
Baths
2,388
Sq Ft
$205/Sq Ft
Est. Value
About This Home
This home is located at 1951 Coes Post Run, Westlake, OH 44145 and is currently estimated at $489,439, approximately $204 per square foot. 1951 Coes Post Run is a home located in Cuyahoga County with nearby schools including Dover Intermediate School, Lee Burneson Middle School, and Westlake High School.
Ownership History
Date
Name
Owned For
Owner Type
Purchase Details
Closed on
Nov 21, 2002
Sold by
The Adenwalla Family Partnership and Adenwalla Shabbir Taher
Bought by
Essi Sharon L
Current Estimated Value
Home Financials for this Owner
Home Financials are based on the most recent Mortgage that was taken out on this home.
Original Mortgage
$205,700
Interest Rate
6.08%
Purchase Details
Closed on
Aug 31, 1989
Sold by
Allega Timothy James
Bought by
Adenwalla Shabbir T
Purchase Details
Closed on
Aug 25, 1986
Sold by
Schultz Edward W
Bought by
Allega Timothy James
Purchase Details
Closed on
Sep 6, 1977
Bought by
Schultz Edward W
Purchase Details
Closed on
Jan 1, 1977
Bought by
Hennie Homes Inc
Create a Home Valuation Report for This Property
The Home Valuation Report is an in-depth analysis detailing your home's value as well as a comparison with similar homes in the area
Home Values in the Area
Average Home Value in this Area
Purchase History
| Date | Buyer | Sale Price | Title Company |
|---|---|---|---|
| Essi Sharon L | $242,000 | Northstar Title Services | |
| Adenwalla Shabbir T | $170,000 | -- | |
| Allega Timothy James | $142,000 | -- | |
| Schultz Edward W | $84,600 | -- | |
| Hennie Homes Inc | -- | -- |
Source: Public Records
Mortgage History
| Date | Status | Borrower | Loan Amount |
|---|---|---|---|
| Previous Owner | Essi Sharon L | $205,700 |
Source: Public Records
Tax History Compared to Growth
Tax History
| Year | Tax Paid | Tax Assessment Tax Assessment Total Assessment is a certain percentage of the fair market value that is determined by local assessors to be the total taxable value of land and additions on the property. | Land | Improvement |
|---|---|---|---|---|
| 2024 | $7,014 | $147,070 | $32,795 | $114,275 |
| 2023 | $5,770 | $104,130 | $26,040 | $78,090 |
| 2022 | $5,678 | $104,130 | $26,040 | $78,090 |
| 2021 | $5,685 | $104,130 | $26,040 | $78,090 |
| 2020 | $5,739 | $96,430 | $24,120 | $72,310 |
| 2019 | $5,564 | $275,500 | $68,900 | $206,600 |
| 2018 | $5,589 | $96,430 | $24,120 | $72,310 |
| 2017 | $5,764 | $93,520 | $23,870 | $69,650 |
| 2016 | $5,733 | $93,520 | $23,870 | $69,650 |
| 2015 | $5,215 | $93,520 | $23,870 | $69,650 |
| 2014 | $5,215 | $83,520 | $21,320 | $62,200 |
Source: Public Records
Map
Nearby Homes
- 1900 Sperrys Forge Trail
- 28744 Woodmill Dr
- 27923 Hilliard Blvd
- 28323 Farrs Garden Path
- 28167 Zinfandel Ct
- Bowman Plan at Hope Pointe Place
- Ashton Plan at Hope Pointe Place
- 1721 Merlot Ln
- 28200 Detroit Rd Unit D3
- 29331 Graystone Dr
- 28140 Detroit Rd Unit D3
- 29379 Detroit Rd
- 29363 Detroit Rd Unit 5
- 0 Hilliard Blvd Unit 5150693
- 0 Hilliard Blvd Unit 5128276
- 28080 Center Ridge Rd
- 1476 Bobby Ln Unit 7
- 2820 N Bay Dr
- 28276 Hallberg Dr
- 28282 Hallberg Dr
- 1959 Coes Post Run
- 1943 Coes Post Run
- 1967 Coes Post Run
- 1935 Coes Post Run
- 1975 Coes Post Run
- 1952 Coes Post Run
- 1960 Coes Post Run
- 1944 Coes Post Run
- 28182 Hilliard Blvd
- 1901 Halls Carriage Path
- 1909 Halls Carriage Path
- 1936 Coes Post Run
- 1968 Coes Post Run
- 1895 Halls Carriage Path
- 1983 Coes Post Run
- 28260 Hilliard Blvd
- 1928 Coes Post Run
- 28160 Hilliard Blvd
- 1991 Coes Post Run
- 1976 Coes Post Run