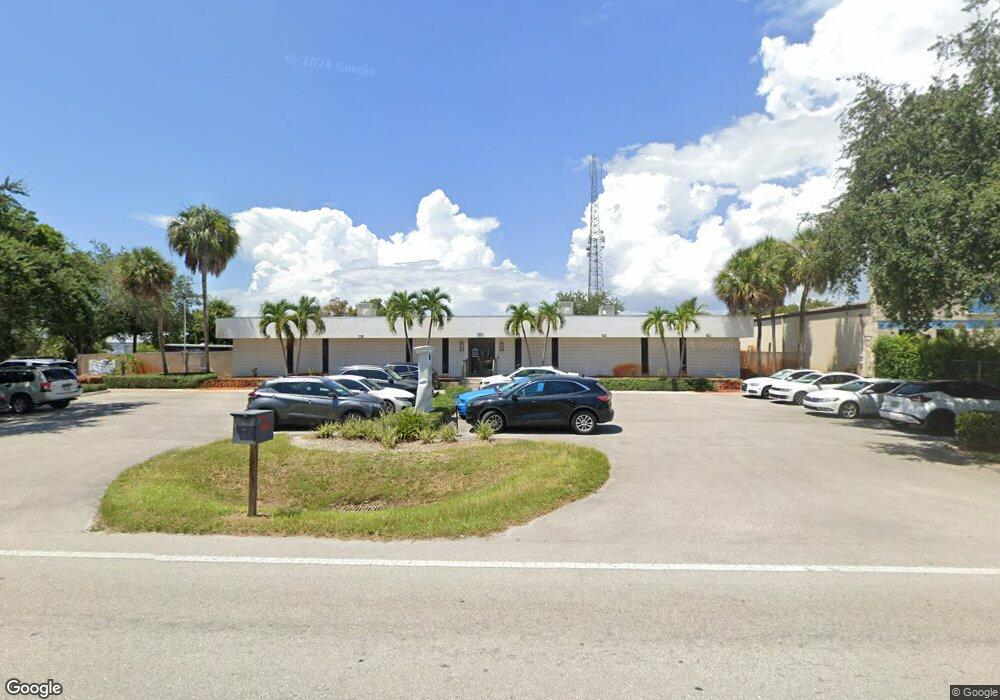
1951 J and C Blvd Naples, FL 34109
Estimated Value: $914,460
--
Bed
--
Bath
5,000
Sq Ft
$183/Sq Ft
Est. Value
About This Home
This home is located at 1951 J and C Blvd, Naples, FL 34109 and is currently estimated at $914,460, approximately $182 per square foot. 1951 J and C Blvd is a home located in Collier County with nearby schools including Sea Gate Elementary School, Pine Ridge Middle School, and Barron Collier High School.
Ownership History
Date
Name
Owned For
Owner Type
Purchase Details
Closed on
Mar 12, 2013
Sold by
Vfc Properties 23 Llc
Bought by
1951 J & C Blvd Llc
Current Estimated Value
Purchase Details
Closed on
Sep 11, 2012
Sold by
Taylor Grace Holdings Llc
Bought by
Synovus Bank
Purchase Details
Closed on
Dec 29, 2003
Sold by
Magnus James C
Bought by
Taylor Grace Holdings L L C
Home Financials for this Owner
Home Financials are based on the most recent Mortgage that was taken out on this home.
Original Mortgage
$546,000
Interest Rate
5.82%
Mortgage Type
Commercial
Purchase Details
Closed on
Oct 20, 2000
Sold by
Harvest Co Of Fl Inc
Bought by
Magnus James G
Purchase Details
Closed on
Jun 30, 1998
Sold by
Certified Diabetic Sup Inc
Bought by
Harvest Co Fl Inc
Home Financials for this Owner
Home Financials are based on the most recent Mortgage that was taken out on this home.
Original Mortgage
$318,500
Interest Rate
7.04%
Purchase Details
Closed on
Nov 13, 1997
Sold by
Baxter Donald Y
Bought by
C T C Group
Create a Home Valuation Report for This Property
The Home Valuation Report is an in-depth analysis detailing your home's value as well as a comparison with similar homes in the area
Home Values in the Area
Average Home Value in this Area
Purchase History
| Date | Buyer | Sale Price | Title Company |
|---|---|---|---|
| 1951 J & C Blvd Llc | $325,000 | Attorney | |
| Synovus Bank | $600 | Attorney | |
| Taylor Grace Holdings L L C | $700,000 | -- | |
| Magnus James G | $475,000 | -- | |
| Harvest Co Fl Inc | $425,000 | -- | |
| C T C Group | $160,000 | -- |
Source: Public Records
Mortgage History
| Date | Status | Borrower | Loan Amount |
|---|---|---|---|
| Previous Owner | Taylor Grace Holdings L L C | $546,000 | |
| Previous Owner | Harvest Co Fl Inc | $318,500 |
Source: Public Records
Tax History Compared to Growth
Tax History
| Year | Tax Paid | Tax Assessment Tax Assessment Total Assessment is a certain percentage of the fair market value that is determined by local assessors to be the total taxable value of land and additions on the property. | Land | Improvement |
|---|---|---|---|---|
| 2025 | $7,975 | $826,904 | $569,350 | $257,554 |
| 2024 | $8,127 | $824,541 | $569,350 | $255,191 |
| 2023 | $8,127 | $819,720 | $569,350 | $250,370 |
| 2022 | $8,139 | $769,405 | $546,576 | $222,829 |
| 2021 | $8,247 | $713,890 | $0 | $0 |
| 2020 | $7,511 | $648,991 | $0 | $0 |
| 2019 | $7,187 | $589,992 | $0 | $0 |
| 2018 | $5,946 | $536,356 | $0 | $0 |
| 2017 | $5,656 | $487,596 | $0 | $0 |
| 2016 | $5,274 | $443,269 | $0 | $0 |
| 2015 | $4,558 | $402,972 | $0 | $0 |
| 2014 | $4,443 | $388,013 | $0 | $0 |
Source: Public Records
Map
Nearby Homes
- 6650 Palisades Ave
- 2094 Arbour Walk Cir Unit 318
- 2094 Arbour Walk Cir Unit 3018
- 6638 Palisades Ave
- 6743 Old Banyan Way
- 6573 Chestnut Cir
- 6576 Chestnut Cir
- 6634 Palisades Ave
- 6658 Palisades Ave
- 6654 Palisades Ave
- 6646 Palisades Ave
- 6642 Palisades Ave
- 6630 Palisades Ave
- 2130 Arbour Walk Cir Unit 2717
- 6689 Mill Run Cir
- 6431 Birchwood Ct
- 1854 Trade Center Way
- 1876 Trade Center Way
- 1892 Trade Center Way
- 1986 J and C Blvd
- 1900 Trade Center Way
- 1826 Trade Center Way
- 1926 Trade Center Way
- 1865 Trade Center Way
- 1786 Trade Center Way Unit 5
- 1786 Trade Center Way Unit 6
- 1849 Trade Center Way
- 1958 Trade Center Way
- 1845 Trade Center Way
- 1857 Trade Center Way
- 1861 Trade Center Way
- 1881 Trade Center Way
- 1853 Trade Center Way
- 1899 Trade Center Way
- 1762 Trade Center Way
- 1827 Trade Center Way