
Landlord's Agent in 2025
Marleny Chacon
Virtual Properties Realty.com
(678) 898-7909
7 in this area
101 Total Sales
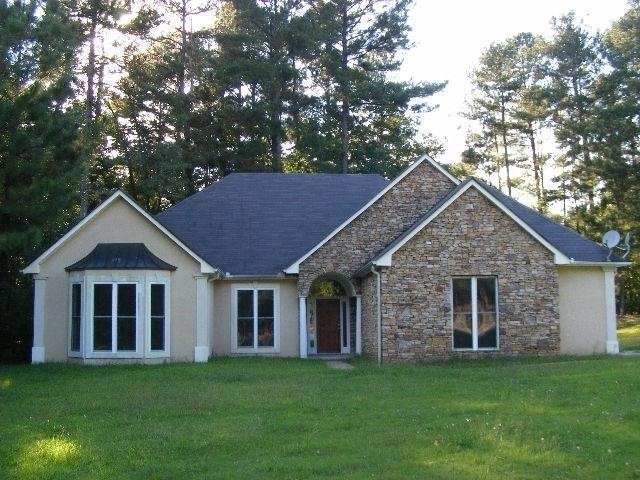
CUSTOM RANCH ON 1.89 ACRES * ENTRY FOYER * HUGE GREAT ROOM TREY CEILING AND FIREPLACE * FORMAL DINING ROOM * SPACIOUS KITCHEN WITH PANTRY * BREAKFAST ROOM * NEW STOVE * NEW DISHWASHER * NEW REFRIGERATOR * MASTER BEDROOM WITH TREY CEILING * MASTER BATH WITH DOUBLE VANITY * JETTED TUB * SEPARATE SHOWER * WALK-IN CLOSET * AMPLE SIZED SECONDARY BEDROOMS * 2 INCH BLINDS THROUGH-OUT * HUGE DECK WITH COVERED AREA * 2 CAR GARAGE WITH SIDE ENTRY * OPENER * LONG DRIVEWAY PROVIDES PLENTY OF PARKING *
Last Agent to Rent the Property
Virtual Properties Realty.com License #174545 Listed on: 03/11/2025
Last Renter's Agent
Berkshire Hathaway HomeServices Georgia Properties License #361250
| Date | Buyer | Sale Price | Title Company |
|---|---|---|---|
| Filaccio Angelo | $101,000 | -- | |
| Gmac Mtg Llc | $116,250 | -- | |
| Humphrey Thomas R | -- | -- |
| Date | Status | Borrower | Loan Amount |
|---|---|---|---|
| Open | Filaccio Angelo | $75,100 |
| Date | Event | Price | List to Sale | Price per Sq Ft | Prior Sale |
|---|---|---|---|---|---|
| 04/04/2025 04/04/25 | Rented | $2,200 | 0.0% | -- | |
| 04/01/2025 04/01/25 | Under Contract | -- | -- | -- | |
| 03/11/2025 03/11/25 | For Rent | $2,200 | +57.1% | -- | |
| 06/23/2018 06/23/18 | Rented | $1,400 | 0.0% | -- | |
| 06/16/2018 06/16/18 | Under Contract | -- | -- | -- | |
| 06/05/2018 06/05/18 | For Rent | $1,400 | 0.0% | -- | |
| 12/27/2017 12/27/17 | Rented | $1,400 | 0.0% | -- | |
| 11/07/2017 11/07/17 | Under Contract | -- | -- | -- | |
| 09/25/2017 09/25/17 | For Rent | $1,400 | 0.0% | -- | |
| 09/15/2016 09/15/16 | Rented | $1,400 | 0.0% | -- | |
| 08/16/2016 08/16/16 | For Rent | $1,400 | +16.7% | -- | |
| 03/14/2014 03/14/14 | Rented | $1,200 | 0.0% | -- | |
| 02/12/2014 02/12/14 | Under Contract | -- | -- | -- | |
| 02/04/2014 02/04/14 | For Rent | $1,200 | 0.0% | -- | |
| 12/16/2013 12/16/13 | Rented | $1,200 | 0.0% | -- | |
| 12/16/2013 12/16/13 | Rented | $1,200 | 0.0% | -- | |
| 11/16/2013 11/16/13 | Under Contract | -- | -- | -- | |
| 11/16/2013 11/16/13 | Under Contract | -- | -- | -- | |
| 11/04/2013 11/04/13 | For Rent | $1,200 | 0.0% | -- | |
| 10/14/2013 10/14/13 | For Rent | $1,200 | 0.0% | -- | |
| 09/11/2012 09/11/12 | Rented | $1,200 | 0.0% | -- | |
| 09/11/2012 09/11/12 | For Rent | $1,200 | 0.0% | -- | |
| 06/28/2012 06/28/12 | Sold | $101,000 | -15.8% | $51 / Sq Ft | View Prior Sale |
| 05/29/2012 05/29/12 | Pending | -- | -- | -- | |
| 01/06/2012 01/06/12 | For Sale | $119,900 | -- | $60 / Sq Ft |
| Year | Tax Paid | Tax Assessment Tax Assessment Total Assessment is a certain percentage of the fair market value that is determined by local assessors to be the total taxable value of land and additions on the property. | Land | Improvement |
|---|---|---|---|---|
| 2024 | $4,495 | $115,920 | $38,000 | $77,920 |
| 2023 | $4,495 | $115,920 | $38,000 | $77,920 |
| 2022 | $3,417 | $86,520 | $21,600 | $64,920 |
| 2021 | $3,462 | $86,520 | $21,600 | $64,920 |
| 2020 | $3,480 | $86,520 | $21,600 | $64,920 |
| 2019 | $2,667 | $66,720 | $16,400 | $50,320 |
| 2018 | $2,665 | $66,720 | $16,400 | $50,320 |
| 2016 | $2,683 | $66,720 | $16,400 | $50,320 |
| 2015 | $2,715 | $66,720 | $16,400 | $50,320 |
| 2014 | -- | $47,440 | $13,200 | $34,240 |
Landlord's Agent in 2025
Marleny Chacon
Virtual Properties Realty.com
(678) 898-7909
7 in this area
101 Total Sales
Tenant's Agent in 2025
Thomas Whitehead
Berkshire Hathaway HomeServices Georgia Properties
(678) 887-7167
1 in this area
35 Total Sales
S
Seller's Agent in 2018
Steve Chacon
NOT A VALID MEMBER
C
Buyer's Agent in 2018
Cindy Broeker
NOT A VALID MEMBER
A
Buyer's Agent in 2016
Ansley Davis
NOT A VALID MEMBER
Buyer's Agent in 2014
DENISE B GOFF
RE/MAX
2 in this area
46 Total Sales
Source: First Multiple Listing Service (FMLS)
MLS Number: 7538512
APN: 5-281-005
Disclaimer: Certain information contained herein is derived from information provided by parties other than Homes.com. All information provided is deemed reliable, but is not guaranteed to be accurate and should be independently verified.
![]() Listings identified with the FMLS IDX logo come from FMLS and are held by brokerage firms other than the owner of this website. The listing brokerage is identified in any listing details. Information is deemed reliable but is not guaranteed. If you believe any FMLS listing contains material that infringes your copyrighted work please visit www.fmls.com/dmca to review our DMCA policy and learn how to submit a takedown request. © 2025 First Multiple Listing Service, Inc.
Listings identified with the FMLS IDX logo come from FMLS and are held by brokerage firms other than the owner of this website. The listing brokerage is identified in any listing details. Information is deemed reliable but is not guaranteed. If you believe any FMLS listing contains material that infringes your copyrighted work please visit www.fmls.com/dmca to review our DMCA policy and learn how to submit a takedown request. © 2025 First Multiple Listing Service, Inc.