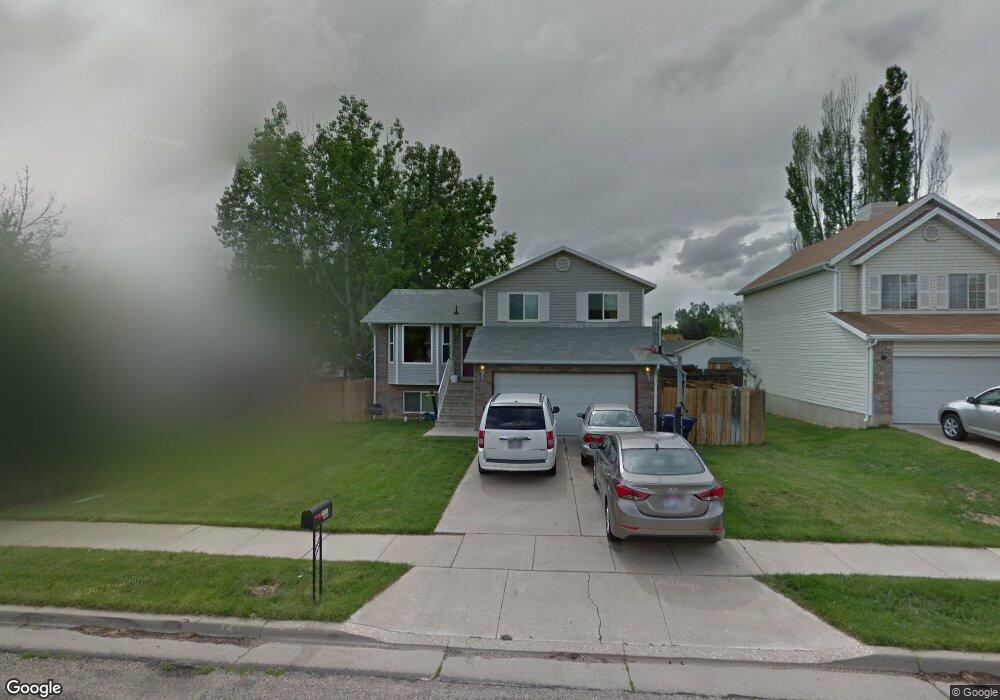
1951 S 100 W Clearfield, UT 84015
Estimated Value: $363,000 - $427,000
2
Beds
1
Bath
1,007
Sq Ft
$404/Sq Ft
Est. Value
About This Home
This home is located at 1951 S 100 W, Clearfield, UT 84015 and is currently estimated at $406,696, approximately $403 per square foot. 1951 S 100 W is a home located in Davis County with nearby schools including Antelope Elementary School, North Davis Junior High School, and Clearfield High School.
Ownership History
Date
Name
Owned For
Owner Type
Purchase Details
Closed on
Jan 18, 2022
Sold by
Birks Randy S
Bought by
Birks Randy S and Birks Stacey A
Current Estimated Value
Home Financials for this Owner
Home Financials are based on the most recent Mortgage that was taken out on this home.
Original Mortgage
$200,651
Outstanding Balance
$156,880
Interest Rate
2.34%
Mortgage Type
FHA
Estimated Equity
$249,816
Purchase Details
Closed on
Jan 5, 2022
Sold by
Birks Randy S and Birks Stacey A
Bought by
Birks Randy S
Home Financials for this Owner
Home Financials are based on the most recent Mortgage that was taken out on this home.
Original Mortgage
$200,651
Outstanding Balance
$156,880
Interest Rate
2.34%
Mortgage Type
FHA
Estimated Equity
$249,816
Create a Home Valuation Report for This Property
The Home Valuation Report is an in-depth analysis detailing your home's value as well as a comparison with similar homes in the area
Home Values in the Area
Average Home Value in this Area
Purchase History
| Date | Buyer | Sale Price | Title Company |
|---|---|---|---|
| Birks Randy S | -- | None Listed On Document | |
| Birks Randy S | -- | Advanced Title Ins Ag |
Source: Public Records
Mortgage History
| Date | Status | Borrower | Loan Amount |
|---|---|---|---|
| Open | Birks Randy S | $200,651 |
Source: Public Records
Tax History
| Year | Tax Paid | Tax Assessment Tax Assessment Total Assessment is a certain percentage of the fair market value that is determined by local assessors to be the total taxable value of land and additions on the property. | Land | Improvement |
|---|---|---|---|---|
| 2025 | $2,277 | $204,050 | $65,215 | $138,835 |
| 2024 | $2,218 | $200,199 | $62,395 | $137,804 |
| 2023 | $2,028 | $336,000 | $100,527 | $235,473 |
| 2022 | $2,179 | $195,250 | $58,237 | $137,013 |
| 2021 | $1,972 | $267,000 | $58,488 | $208,512 |
| 2020 | $1,711 | $230,000 | $48,575 | $181,425 |
| 2019 | $1,642 | $218,000 | $53,204 | $164,796 |
| 2018 | $1,492 | $193,000 | $47,224 | $145,776 |
| 2016 | $1,311 | $88,660 | $18,637 | $70,023 |
| 2015 | $1,261 | $81,290 | $18,637 | $62,653 |
| 2014 | $1,162 | $75,928 | $18,637 | $57,291 |
| 2013 | -- | $72,450 | $28,304 | $44,146 |
Source: Public Records
Map
Nearby Homes
- 369 W 1900 S
- 1685 S 245 W
- 2345 S Main St
- 195 E 2325 S
- 2191 S 550 W
- 2480 S Main St
- 1250 N 2925 W
- 3250 W 1075 N
- 460 E 1700 S Unit 1 & 2
- 1969 S 575 E
- 864 W 1840 S Unit D
- 3389 W Gordon Ave
- 907 W 1840 S Unit C
- 1877 S 725 E
- 929 W 1920 S Unit A
- 961 1910 S
- 1553 S 900 W
- 1553 S 900 W Unit 139
- 1547 S 900 W
- 3246 W 850 N Unit 114
Your Personal Tour Guide
Ask me questions while you tour the home.