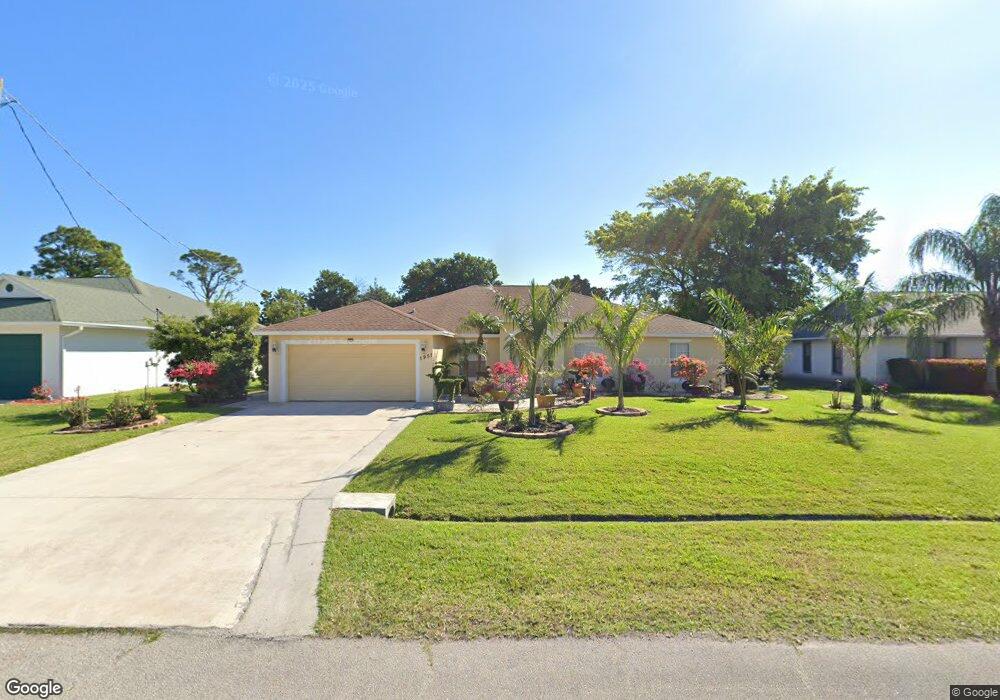
1951 SE Camden St Port Saint Lucie, FL 34952
Sandhill Crossing NeighborhoodEstimated Value: $415,570 - $562,000
4
Beds
3
Baths
2,082
Sq Ft
$225/Sq Ft
Est. Value
About This Home
This home is located at 1951 SE Camden St, Port Saint Lucie, FL 34952 and is currently estimated at $468,893, approximately $225 per square foot. 1951 SE Camden St is a home located in St. Lucie County with nearby schools including Mariposa Elementary School, Morningside Elementary School, and Floresta Elementary School.
Ownership History
Date
Name
Owned For
Owner Type
Purchase Details
Closed on
Nov 21, 2016
Sold by
Phan Ha
Bought by
Phan Chan M and Tran Danh T
Current Estimated Value
Purchase Details
Closed on
Jun 6, 2008
Sold by
Zanatta Patrick A and Rodriguez Vera
Bought by
Phan Ha T
Home Financials for this Owner
Home Financials are based on the most recent Mortgage that was taken out on this home.
Original Mortgage
$117,000
Outstanding Balance
$74,963
Interest Rate
6.02%
Mortgage Type
Purchase Money Mortgage
Estimated Equity
$393,930
Purchase Details
Closed on
Feb 6, 2006
Sold by
Chateau Homes Inc
Bought by
Zanatta Patrick A and Rodriguez Vera
Home Financials for this Owner
Home Financials are based on the most recent Mortgage that was taken out on this home.
Original Mortgage
$56,222
Interest Rate
5.7%
Mortgage Type
Stand Alone Second
Purchase Details
Closed on
May 3, 2005
Sold by
Innovative Construction Co Llc
Bought by
Chateau Homes Inc
Create a Home Valuation Report for This Property
The Home Valuation Report is an in-depth analysis detailing your home's value as well as a comparison with similar homes in the area
Home Values in the Area
Average Home Value in this Area
Purchase History
| Date | Buyer | Sale Price | Title Company |
|---|---|---|---|
| Phan Chan M | -- | None Available | |
| Phan Ha T | $217,000 | First American Title Ins Co | |
| Zanatta Patrick A | $281,200 | Priority Title Inc | |
| Chateau Homes Inc | $70,000 | Priority Title Inc |
Source: Public Records
Mortgage History
| Date | Status | Borrower | Loan Amount |
|---|---|---|---|
| Open | Phan Ha T | $117,000 | |
| Previous Owner | Zanatta Patrick A | $56,222 | |
| Previous Owner | Zanatta Patrick A | $224,890 |
Source: Public Records
Tax History Compared to Growth
Tax History
| Year | Tax Paid | Tax Assessment Tax Assessment Total Assessment is a certain percentage of the fair market value that is determined by local assessors to be the total taxable value of land and additions on the property. | Land | Improvement |
|---|---|---|---|---|
| 2024 | $4,520 | $221,352 | -- | -- |
| 2023 | $4,520 | $214,905 | $0 | $0 |
| 2022 | $4,358 | $208,646 | $0 | $0 |
| 2021 | $4,292 | $202,569 | $0 | $0 |
| 2020 | $4,323 | $199,773 | $0 | $0 |
| 2019 | $4,286 | $195,282 | $0 | $0 |
| 2018 | $4,083 | $191,641 | $0 | $0 |
| 2017 | $4,041 | $187,700 | $29,100 | $158,600 |
| 2016 | $2,334 | $167,800 | $22,400 | $145,400 |
| 2015 | $2,354 | $138,200 | $14,900 | $123,300 |
| 2014 | $2,239 | $116,725 | $0 | $0 |
Source: Public Records
Map
Nearby Homes
- 1932 SE Camilo St
- 2101 SE Camden St
- 1925 SE Mantua St
- 2014 SE Mantua St
- 3302 SE Guinevere Ln
- 2452 SE Victory Ave
- 1803 SE Sir Lancelot Dr Unit C
- 2004 SE Round Table Dr Unit D
- 2203 SE Round Table Dr Unit C
- 402 SE Castle Ct Unit B
- 2433 SE Renick Ave
- 2077 SE Camden St
- 2092 SE Mary Terrace
- 2017 SE Parrot St
- 2442 SE Pascal Ave
- 2448 SE Pascal Ave
- 4293 SE Brittney Cir
- 2477 SE Renick Ave
- 2322 SE Maslan Ave
- 1857 SE Bowie St
- 1941 SE Camden St
- 1961 SE Camden St
- 1962 SE Camilo St
- 1952 SE Camilo St
- 1931 SE Camden St
- 1971 SE Camden St
- 1972 SE Camilo St
- 1950 SE Camden St
- 1942 SE Camden St
- 1958 SE Camden St
- 1982 SE Camilo St
- 1921 SE Camden St
- 1981 SE Camden St
- 1934 SE Camden St
- 1966 SE Camden St
- 1922 SE Camilo St
- 1951 SE Camilo St
- 1941 SE Camilo St
- 1992 SE Camilo St
- 1991 SE Camden St