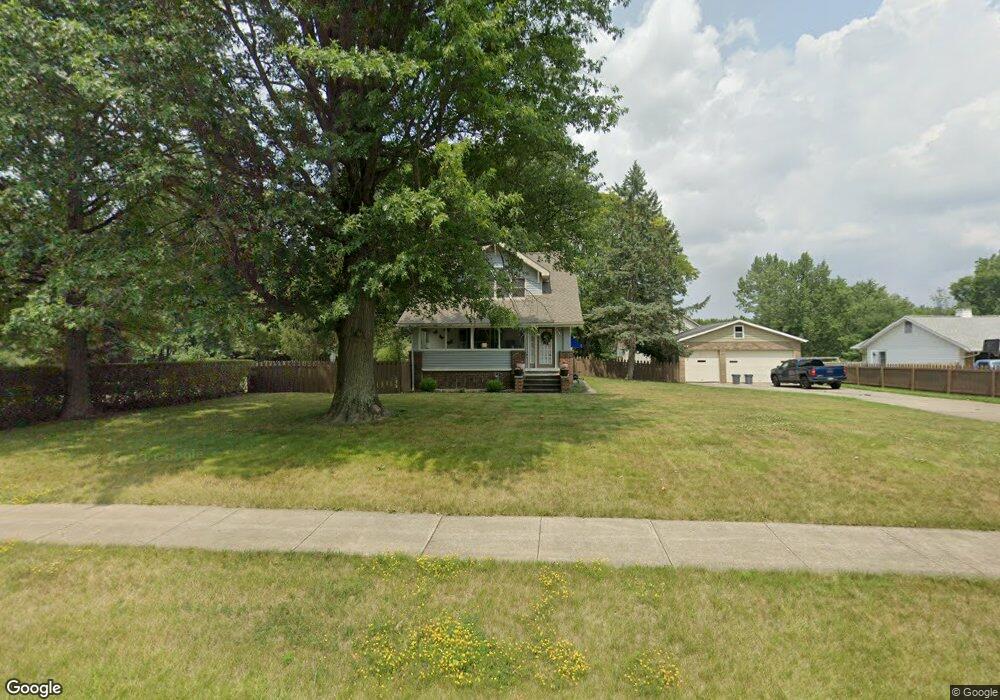
19510 Lunn Rd Strongsville, OH 44149
Estimated Value: $270,000 - $322,000
3
Beds
2
Baths
1,218
Sq Ft
$239/Sq Ft
Est. Value
About This Home
This home is located at 19510 Lunn Rd, Strongsville, OH 44149 and is currently estimated at $290,798, approximately $238 per square foot. 19510 Lunn Rd is a home located in Cuyahoga County with nearby schools including Strongsville High School, Strongsville Academy, and Sts Joseph & John Interparochial School.
Ownership History
Date
Name
Owned For
Owner Type
Purchase Details
Closed on
Oct 20, 2015
Sold by
Schraibman Charlene G
Bought by
Schraibman Jason W
Current Estimated Value
Purchase Details
Closed on
Oct 31, 2001
Sold by
Hilke Duane E and Hilke Linda M
Bought by
Schraibman Jason W and Schraibman Charlene G
Home Financials for this Owner
Home Financials are based on the most recent Mortgage that was taken out on this home.
Original Mortgage
$155,500
Outstanding Balance
$60,643
Interest Rate
6.69%
Estimated Equity
$230,155
Purchase Details
Closed on
Jun 1, 1993
Sold by
Feghali Jean B
Bought by
Hilke Duane E
Purchase Details
Closed on
Aug 1, 1990
Sold by
Suljagic Ljubo and Suljagic Martha
Bought by
Feghali Jean B
Purchase Details
Closed on
Jan 1, 1975
Bought by
Suljagic Ljubo and Suljagic Martha
Create a Home Valuation Report for This Property
The Home Valuation Report is an in-depth analysis detailing your home's value as well as a comparison with similar homes in the area
Home Values in the Area
Average Home Value in this Area
Purchase History
| Date | Buyer | Sale Price | Title Company |
|---|---|---|---|
| Schraibman Jason W | -- | Attorney | |
| Schraibman Jason W | $183,000 | -- | |
| Hilke Duane E | $107,000 | -- | |
| Feghali Jean B | $108,500 | -- | |
| Suljagic Ljubo | -- | -- |
Source: Public Records
Mortgage History
| Date | Status | Borrower | Loan Amount |
|---|---|---|---|
| Open | Schraibman Jason W | $155,500 |
Source: Public Records
Tax History Compared to Growth
Tax History
| Year | Tax Paid | Tax Assessment Tax Assessment Total Assessment is a certain percentage of the fair market value that is determined by local assessors to be the total taxable value of land and additions on the property. | Land | Improvement |
|---|---|---|---|---|
| 2024 | $4,498 | $95,795 | $11,655 | $84,140 |
| 2023 | $4,031 | $64,370 | $16,450 | $47,920 |
| 2022 | $4,001 | $64,370 | $16,450 | $47,920 |
| 2021 | $3,970 | $64,370 | $16,450 | $47,920 |
| 2020 | $3,936 | $56,460 | $14,420 | $42,040 |
| 2019 | $3,820 | $161,300 | $41,200 | $120,100 |
| 2018 | $3,467 | $56,460 | $14,420 | $42,040 |
| 2017 | $3,569 | $53,800 | $11,730 | $42,070 |
| 2016 | $3,540 | $53,800 | $11,730 | $42,070 |
| 2015 | $5,292 | $53,800 | $11,730 | $42,070 |
| 2014 | $5,292 | $52,230 | $11,380 | $40,850 |
Source: Public Records
Map
Nearby Homes
- 19513 Lunn Rd
- 19620 Porters Ln Unit 15F
- 20078 Trapper Trail
- 18630 Shurmer Rd
- 14112 Settlers Way
- 19160 Wheelers Ln
- 15279 Walnut Creek Dr
- 19311 Bradford Ct
- 19908 Stoughton Dr
- 15017 Regency Dr
- 18162 Fawn Cir
- 19297 Lauren Way
- 20678 Spruce Dr
- 14896 Britannia Ct
- 17069 Partridge Dr
- 20393 Wildwood Ln
- 17259 Woodshire Dr
- 13156 Olympus Way
- 13099 Olympus Way
- 13066 Olympus Way
- 19452 Lunn Rd
- 15051 Ranchwood Dr
- 19444 Lunn Rd
- 19444 Lunn Rd
- 19546 Lunn Rd
- 19483 Lunn Rd
- 19453 Lunn Rd
- 19407 Winding Trail
- 19580 Lunn Rd
- 19421 Winding Trail
- 19429 Winding Trail
- 19393 Winding Trail
- 19443 Winding Trail
- 19610 Lunn Rd
- 19457 Winding Trail
- 19380 Winding Trail
- 19644 Lunn Rd
- 19351 Lunn Rd
- 19330 Lunn Rd
- 19471 Winding Trail