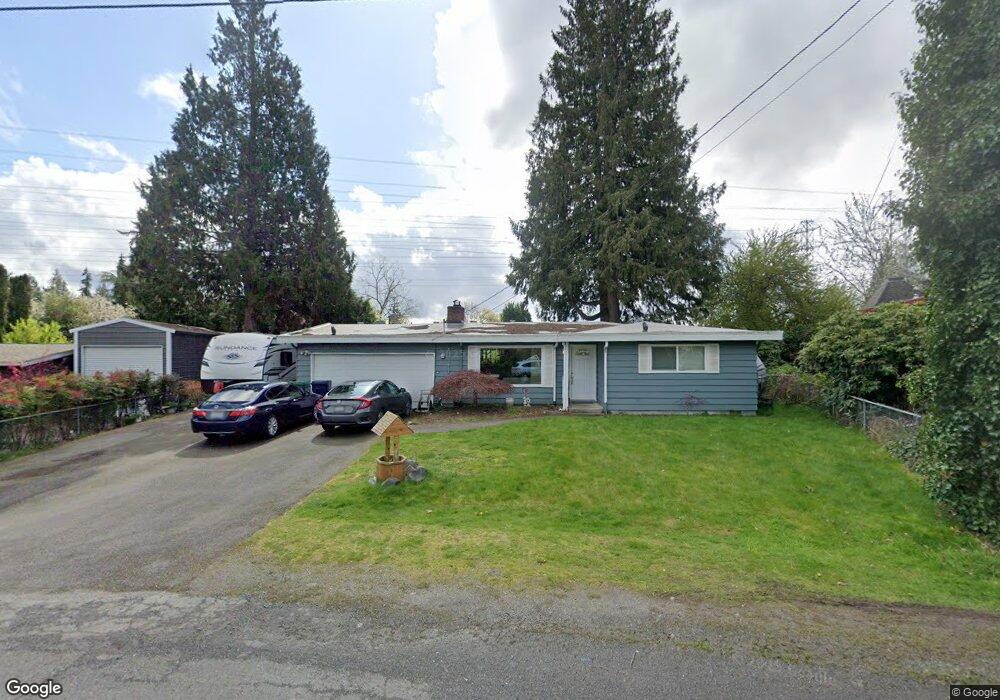
19518 Winesap Ln Bothell, WA 98012
Queensborough-Brentwood NeighborhoodEstimated Value: $694,000 - $786,000
3
Beds
2
Baths
1,200
Sq Ft
$622/Sq Ft
Est. Value
About This Home
This home is located at 19518 Winesap Ln, Bothell, WA 98012 and is currently estimated at $746,065, approximately $621 per square foot. 19518 Winesap Ln is a home located in Snohomish County with nearby schools including Frank Love Elementary School, Kenmore Middle School, and Bothell High School.
Ownership History
Date
Name
Owned For
Owner Type
Purchase Details
Closed on
Jan 14, 2005
Sold by
Morgan Darrell A and Morgan Julia C
Bought by
Sellars David A and Sellars Kimberly A
Current Estimated Value
Home Financials for this Owner
Home Financials are based on the most recent Mortgage that was taken out on this home.
Original Mortgage
$187,990
Outstanding Balance
$90,206
Interest Rate
5.62%
Mortgage Type
Purchase Money Mortgage
Estimated Equity
$655,860
Purchase Details
Closed on
Apr 12, 2000
Sold by
Lybeck Greg E and Lybeck Annette E
Bought by
Morgan Darrell A and Morgan Julia C
Home Financials for this Owner
Home Financials are based on the most recent Mortgage that was taken out on this home.
Original Mortgage
$177,655
Interest Rate
8.26%
Mortgage Type
FHA
Create a Home Valuation Report for This Property
The Home Valuation Report is an in-depth analysis detailing your home's value as well as a comparison with similar homes in the area
Home Values in the Area
Average Home Value in this Area
Purchase History
| Date | Buyer | Sale Price | Title Company |
|---|---|---|---|
| Sellars David A | $234,999 | Pnwt | |
| Morgan Darrell A | $180,000 | Transnation Title Insurance |
Source: Public Records
Mortgage History
| Date | Status | Borrower | Loan Amount |
|---|---|---|---|
| Open | Sellars David A | $187,990 | |
| Previous Owner | Morgan Darrell A | $177,655 | |
| Closed | Sellars David A | $47,000 |
Source: Public Records
Tax History
| Year | Tax Paid | Tax Assessment Tax Assessment Total Assessment is a certain percentage of the fair market value that is determined by local assessors to be the total taxable value of land and additions on the property. | Land | Improvement |
|---|---|---|---|---|
| 2026 | $5,759 | $637,300 | $484,700 | $152,600 |
| 2025 | $5,583 | $635,900 | $427,700 | $208,200 |
| 2024 | $5,583 | $616,900 | $408,700 | $208,200 |
| 2023 | $5,443 | $670,200 | $461,000 | $209,200 |
| 2022 | $5,114 | $500,800 | $322,300 | $178,500 |
| 2020 | $4,326 | $398,600 | $242,300 | $156,300 |
| 2019 | $3,327 | $307,800 | $209,000 | $98,800 |
| 2018 | $3,292 | $283,800 | $194,800 | $89,000 |
| 2017 | $2,541 | $220,900 | $137,800 | $83,100 |
| 2016 | $2,477 | $210,000 | $128,300 | $81,700 |
| 2015 | $2,571 | $207,600 | $121,600 | $86,000 |
| 2013 | $2,439 | $175,200 | $99,800 | $75,400 |
Source: Public Records
Map
Nearby Homes
- 19424 Winesap Rd
- 603 194th Place SE
- 532 198th St SE
- 707 Harvest Rd
- 19424 2nd Dr SE Unit B
- 19814 10th Dr SE
- 525 192nd Place SE
- 19922 3rd Dr SE
- 19921 10th Dr SE
- 1332 192nd St SE Unit 50
- 19221 Meridian Dr SE Unit CW 16
- 1322 194th St SE Unit B4
- 1322 194th St SE Unit B6
- 19127 Meridian Dr SE Unit CW 17
- 1402 194th St SE Unit 9
- 303 Poppy Rd
- 19112 Meridian Dr SE Unit CW 01
- 20304 3rd Dr SE Unit 28
- 19220 Meridian Dr SE Unit CW 08
- 20224 11th Dr SE
- 19522 Winesap Ln
- 19516 Winesap Ln
- 519 196th St SE
- 19524 Winesap Ln
- 19517 Winesap Ln
- 603 197th St SE
- 515 196th St SE
- 19514 Winesap Ln
- 19509 Winesap Ln
- 511 196th St SE
- 19521 Winesap Ln
- 609 197th St SE
- 507 196th St SE
- 602 197th St SE
- 627 196th Place SE
- 19525 Winesap Ln
- 19433 Winesap Ln
- 610 197th St SE
- 19512 Winesap Ln
Your Personal Tour Guide
Ask me questions while you tour the home.