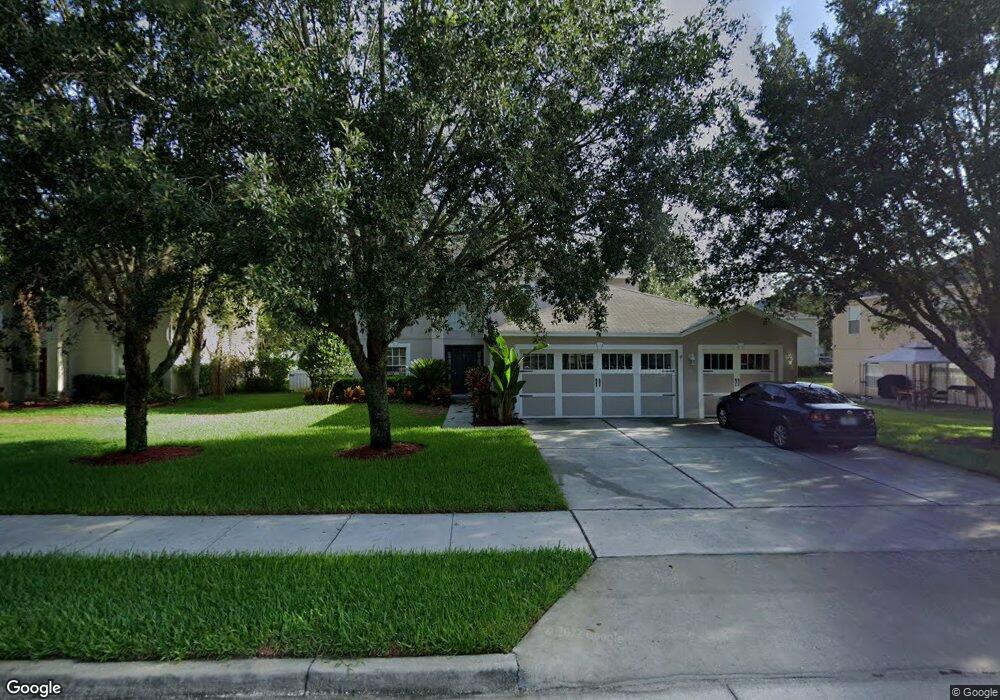
1952 Alambra Cir Apopka, FL 32703
Estimated Value: $396,447 - $456,000
3
Beds
3
Baths
2,893
Sq Ft
$148/Sq Ft
Est. Value
About This Home
This home is located at 1952 Alambra Cir, Apopka, FL 32703 and is currently estimated at $428,612, approximately $148 per square foot. 1952 Alambra Cir is a home located in Orange County with nearby schools including Wheatley Elementary School, Piedmont Lakes Middle School, and Wekiva High School.
Ownership History
Date
Name
Owned For
Owner Type
Purchase Details
Closed on
Sep 5, 2014
Sold by
Fannie Mae
Bought by
Knight Robert
Current Estimated Value
Home Financials for this Owner
Home Financials are based on the most recent Mortgage that was taken out on this home.
Original Mortgage
$199,900
Outstanding Balance
$153,093
Interest Rate
4.15%
Mortgage Type
VA
Estimated Equity
$275,519
Purchase Details
Closed on
Mar 11, 2014
Sold by
Norman Kristopher A
Bought by
Federal National Mortgage Association
Purchase Details
Closed on
Oct 27, 2006
Sold by
Maronda Homes Inc Of Florida
Bought by
Norman Kristopher A and Zeak Kimberly M
Home Financials for this Owner
Home Financials are based on the most recent Mortgage that was taken out on this home.
Original Mortgage
$156,380
Interest Rate
6.39%
Mortgage Type
Unknown
Create a Home Valuation Report for This Property
The Home Valuation Report is an in-depth analysis detailing your home's value as well as a comparison with similar homes in the area
Home Values in the Area
Average Home Value in this Area
Purchase History
| Date | Buyer | Sale Price | Title Company |
|---|---|---|---|
| Knight Robert | $199,900 | Del Mar Title Services Llc | |
| Federal National Mortgage Association | $123,500 | None Available | |
| Norman Kristopher A | $195,500 | Kampf Title & Guaranty Corp |
Source: Public Records
Mortgage History
| Date | Status | Borrower | Loan Amount |
|---|---|---|---|
| Open | Knight Robert | $199,900 | |
| Previous Owner | Norman Kristopher A | $156,380 |
Source: Public Records
Tax History Compared to Growth
Tax History
| Year | Tax Paid | Tax Assessment Tax Assessment Total Assessment is a certain percentage of the fair market value that is determined by local assessors to be the total taxable value of land and additions on the property. | Land | Improvement |
|---|---|---|---|---|
| 2025 | $2,835 | $223,381 | -- | -- |
| 2024 | $2,643 | $223,381 | -- | -- |
| 2023 | $2,643 | $210,763 | $0 | $0 |
| 2022 | $2,529 | $204,624 | $0 | $0 |
| 2021 | $2,485 | $198,664 | $0 | $0 |
| 2020 | $2,378 | $195,921 | $0 | $0 |
| 2019 | $2,414 | $191,516 | $0 | $0 |
| 2018 | $2,388 | $187,945 | $0 | $0 |
| 2017 | $2,321 | $194,947 | $40,000 | $154,947 |
| 2016 | $2,312 | $180,293 | $30,000 | $150,293 |
| 2015 | $2,773 | $165,366 | $25,000 | $140,366 |
| 2014 | $2,112 | $123,574 | $7,000 | $116,574 |
Source: Public Records
Map
Nearby Homes
- 1745 Alambra Cir
- 824 La Gran Via Ln
- 1120 Dunbridge St
- 1600 Cimarron Hills Dr
- 1638 Grand Oak Dr
- 1921 Burberry St
- 1265 Sheeler Hills Dr
- 1105 Mill Run Cir
- 0 Sheeler Oaks Dr Unit MFRO6337662
- 1027 Sheeler Hills Dr
- 2250 Acca Alley
- 2293 Aloe Alley
- 1246 Crossfield Dr
- 1250 Lacey Oak Dr
- 1928 Old Apopka Rd
- 1256 Pin Oak Dr
- 2074 Wenthworth Cir
- 2135 Cobblefield Cir
- 1700 Old Apopka Rd
- 2080 Cobblefield Cir
- 1960 Alambra Cir
- 1959 Alambra Cir
- 1706 Alambra Cir
- 1951 Alambra Cir
- 1848 Alambra Cir
- 1714 Alambra Cir
- 1967 Alambra Cir
- 1943 Alambra Cir
- 1840 Alambra Cir
- 1975 Alambra Cir
- 1722 Alambra Cir
- 1832 Alambra Cir
- 1713 Alambra Cir
- 1730 Alambra Cir
- 1855 Alambra Cir
- 1847 Alambra Cir
- 1770 Alambra Cir
- 1721 Alambra Cir
- 1778 Alambra Cir
- 1983 Alambra Cir