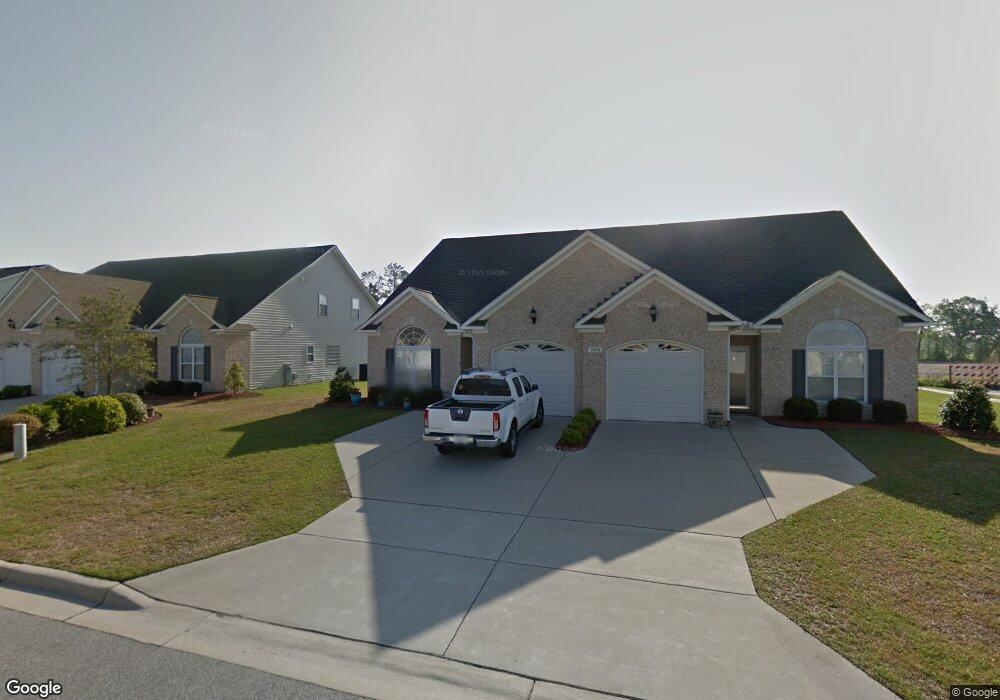
1952 Cambria Dr Greenville, NC 27834
Estimated Value: $244,000 - $270,000
--
Bed
3
Baths
1,606
Sq Ft
$160/Sq Ft
Est. Value
About This Home
This home is located at 1952 Cambria Dr, Greenville, NC 27834 and is currently estimated at $256,545, approximately $159 per square foot. 1952 Cambria Dr is a home located in Pitt County with nearby schools including Lakeforest Elementary School, E.B. Aycock Middle School, and South Central High School.
Ownership History
Date
Name
Owned For
Owner Type
Purchase Details
Closed on
Jun 18, 2021
Sold by
Campos Deborah J and Campos Jhonny
Bought by
Bui Andy and Bui Din
Current Estimated Value
Home Financials for this Owner
Home Financials are based on the most recent Mortgage that was taken out on this home.
Original Mortgage
$117,000
Outstanding Balance
$105,929
Interest Rate
2.9%
Mortgage Type
New Conventional
Estimated Equity
$150,616
Purchase Details
Closed on
May 23, 2014
Sold by
Lemmon Jennifer Lynne and Lemmon Jonathan Andrew
Bought by
Campos Deborah J
Home Financials for this Owner
Home Financials are based on the most recent Mortgage that was taken out on this home.
Original Mortgage
$130,591
Interest Rate
4.37%
Mortgage Type
FHA
Create a Home Valuation Report for This Property
The Home Valuation Report is an in-depth analysis detailing your home's value as well as a comparison with similar homes in the area
Home Values in the Area
Average Home Value in this Area
Purchase History
| Date | Buyer | Sale Price | Title Company |
|---|---|---|---|
| Bui Andy | $190,000 | First American Mortgage Sln | |
| Campos Deborah J | $133,000 | None Available |
Source: Public Records
Mortgage History
| Date | Status | Borrower | Loan Amount |
|---|---|---|---|
| Open | Bui Andy | $117,000 | |
| Previous Owner | Campos Deborah J | $130,591 |
Source: Public Records
Tax History Compared to Growth
Tax History
| Year | Tax Paid | Tax Assessment Tax Assessment Total Assessment is a certain percentage of the fair market value that is determined by local assessors to be the total taxable value of land and additions on the property. | Land | Improvement |
|---|---|---|---|---|
| 2025 | $2,399 | $234,493 | $35,000 | $199,493 |
| 2024 | $2,387 | $234,493 | $35,000 | $199,493 |
| 2023 | $1,935 | $156,374 | $18,000 | $138,374 |
| 2022 | $1,955 | $156,374 | $18,000 | $138,374 |
| 2021 | $1,935 | $156,374 | $18,000 | $138,374 |
| 2020 | $1,950 | $156,374 | $18,000 | $138,374 |
| 2019 | $1,744 | $133,503 | $18,000 | $115,503 |
| 2018 | $1,694 | $133,503 | $18,000 | $115,503 |
| 2017 | $1,694 | $133,503 | $18,000 | $115,503 |
| 2016 | $1,645 | $133,503 | $18,000 | $115,503 |
| 2015 | $1,645 | $131,143 | $18,000 | $113,143 |
| 2014 | $1,645 | $131,143 | $18,000 | $113,143 |
Source: Public Records
Map
Nearby Homes
- 1805 Leighton Dr Unit A
- 2100 Dartford Dr Unit A
- 2028 Dartford Dr Unit A
- 2108 Dartford Dr Unit B
- 2028 Dartford Dr Unit B
- 2000 Dartford Dr Unit A
- 2000 Dartford Dr Unit B
- 2013 Dartford Dr Unit B
- 2021 Dartford Dr Unit B
- 1404 Hartley Ln Unit A
- 2316 Dovedale Dr Unit A
- 1856 Cambria Dr Unit B
- 2324 Dovedale Dr Unit B
- 2001 Newbury Way Unit F
- 2001 Newbury Way Unit E
- 2001 Newbury Way Unit D
- 2001 Newbury Way Unit B
- 2001 Newbury Way Unit A
- 2001 Newbury Way Unit C
- 2052 Cambria Dr Unit B
- 1952 Cambria Dr
- 1952 Cambria Dr Unit A
- 1952 Cambria Dr Unit B
- 1948 Cambria Dr
- 1948 Cambria Dr
- 1948 Cambria Dr Unit B
- 1948 B Cambria Dr
- 1948 Cambria Dr Unit A
- 2000 Cambria Dr
- 2000 Cambria Dr
- 2000 Cambria Dr Unit B
- 2000 Cambria Dr Unit A
- 2100 Dartford Dr Unit B
- 2020 Dartford Dr Unit A
- 2020 Dartford Dr Unit B
- 1951 Cambria Dr
- 1951 Cambria Dr
- 1951 Cambria Dr Unit B
- 2001 Cambria Dr
- 2001 Cambria Dr