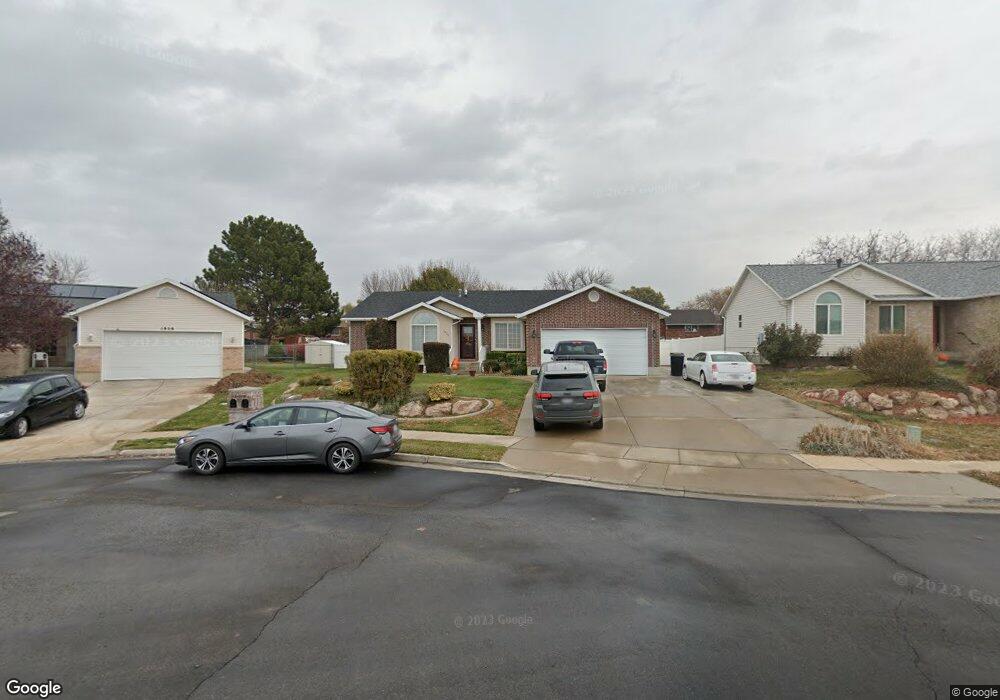
1952 N 660 W Clearfield, UT 84015
Estimated Value: $497,000 - $522,000
5
Beds
3
Baths
2,672
Sq Ft
$192/Sq Ft
Est. Value
About This Home
This home is located at 1952 N 660 W, Clearfield, UT 84015 and is currently estimated at $512,712, approximately $191 per square foot. 1952 N 660 W is a home located in Davis County with nearby schools including Sunset School, Sunset Junior High School, and Northridge High School.
Ownership History
Date
Name
Owned For
Owner Type
Purchase Details
Closed on
Oct 10, 2019
Sold by
Castoreno Roy and Castoreno Rose Marie
Bought by
Castoreno Roy and Castoreno Rose Marie
Current Estimated Value
Home Financials for this Owner
Home Financials are based on the most recent Mortgage that was taken out on this home.
Original Mortgage
$309,900
Outstanding Balance
$270,323
Interest Rate
3.4%
Mortgage Type
VA
Estimated Equity
$242,389
Purchase Details
Closed on
May 7, 2013
Sold by
Budge Wayne Orson and Budge Alta F
Bought by
Castoreno Roy and Castoreno Rose Marie
Home Financials for this Owner
Home Financials are based on the most recent Mortgage that was taken out on this home.
Original Mortgage
$218,996
Interest Rate
3.5%
Mortgage Type
VA
Purchase Details
Closed on
Aug 23, 2000
Sold by
Moyes William Scott and Moyes Phyllis K
Bought by
Budge Wayne Orson and Budge Alta F
Create a Home Valuation Report for This Property
The Home Valuation Report is an in-depth analysis detailing your home's value as well as a comparison with similar homes in the area
Home Values in the Area
Average Home Value in this Area
Purchase History
| Date | Buyer | Sale Price | Title Company |
|---|---|---|---|
| Castoreno Roy | -- | Hickman Land Title | |
| Castoreno Roy | -- | Bonneville Superior Title Co | |
| Budge Wayne Orson | -- | Mountain View Title & Escrow |
Source: Public Records
Mortgage History
| Date | Status | Borrower | Loan Amount |
|---|---|---|---|
| Open | Castoreno Roy | $309,900 | |
| Closed | Castoreno Roy | $218,996 |
Source: Public Records
Tax History Compared to Growth
Tax History
| Year | Tax Paid | Tax Assessment Tax Assessment Total Assessment is a certain percentage of the fair market value that is determined by local assessors to be the total taxable value of land and additions on the property. | Land | Improvement |
|---|---|---|---|---|
| 2025 | $2,791 | $268,400 | $86,993 | $181,407 |
| 2024 | $2,680 | $259,050 | $95,964 | $163,086 |
| 2023 | $2,510 | $449,000 | $108,586 | $340,414 |
| 2022 | $2,646 | $261,800 | $67,156 | $194,644 |
| 2021 | $2,351 | $345,000 | $82,833 | $262,167 |
| 2020 | $2,045 | $297,000 | $69,736 | $227,264 |
| 2019 | $1,945 | $276,000 | $82,697 | $193,303 |
| 2018 | $1,836 | $256,000 | $70,008 | $185,992 |
| 2016 | $1,763 | $126,940 | $27,124 | $99,816 |
| 2015 | $1,675 | $114,620 | $27,124 | $87,496 |
| 2014 | $1,608 | $111,799 | $27,124 | $84,675 |
| 2013 | -- | $107,967 | $27,143 | $80,824 |
Source: Public Records
Map
Nearby Homes
- 648 W 2200 N
- 2177 N 450 W
- 1746 N 475 W
- 1721 N 400 W
- 1696 N 475 W
- 2382 N 770 W
- 1874 N 200 W
- 36 W 1600 N
- 1438 N 475 W
- 2486 N 690 W
- 1534 N 300 W
- 1974 N 75 W
- 2085 N Main St Unit 409
- 2085 N Main St Unit 108
- 2085 N Main St Unit 401
- 2085 N Main St Unit 308
- 2085 N Main St Unit 116
- 2085 N Main St Unit 201
- 2085 N Main St Unit 402
- 2085 N Main St Unit 202