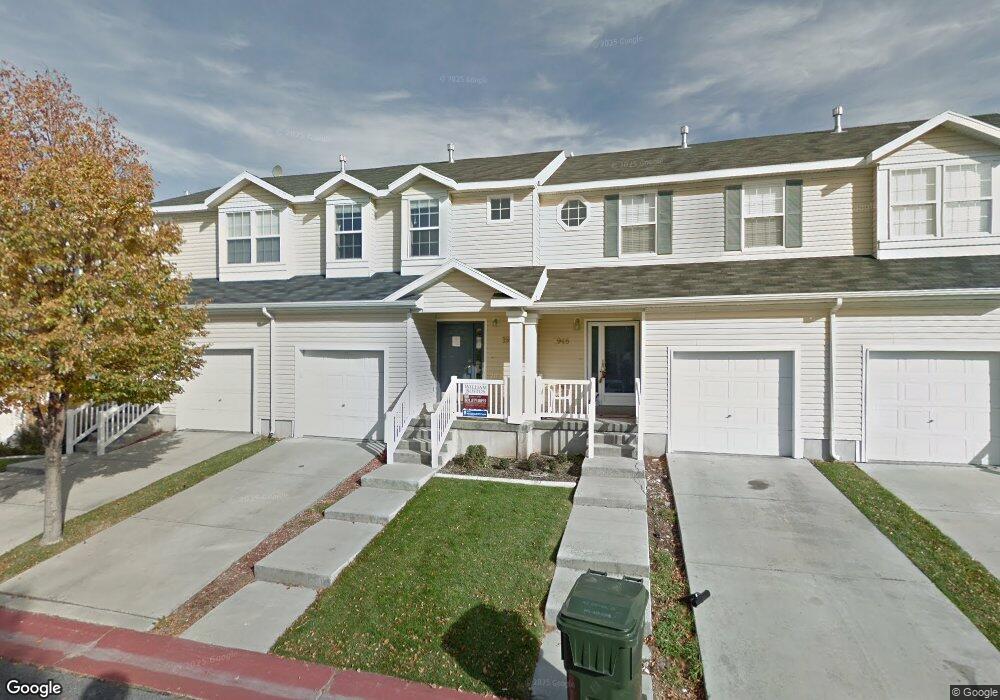
1952 N 70 W Tooele, UT 84074
Estimated Value: $309,000 - $327,155
4
Beds
3
Baths
1,920
Sq Ft
$166/Sq Ft
Est. Value
About This Home
This home is located at 1952 N 70 W, Tooele, UT 84074 and is currently estimated at $318,039, approximately $165 per square foot. 1952 N 70 W is a home located in Tooele County with nearby schools including Overlake Elementary School, Clarke N. Johnsen Junior High School, and Stansbury High School.
Ownership History
Date
Name
Owned For
Owner Type
Purchase Details
Closed on
Aug 10, 2018
Sold by
Marble Cory
Bought by
Marble Cory and Eden Rela
Current Estimated Value
Home Financials for this Owner
Home Financials are based on the most recent Mortgage that was taken out on this home.
Original Mortgage
$172,175
Outstanding Balance
$149,527
Interest Rate
4.5%
Mortgage Type
New Conventional
Estimated Equity
$168,512
Purchase Details
Closed on
Aug 9, 2018
Sold by
Fullmer Tyler W and Southerland Miranda Michelle
Bought by
Marble Cory
Home Financials for this Owner
Home Financials are based on the most recent Mortgage that was taken out on this home.
Original Mortgage
$172,175
Outstanding Balance
$149,527
Interest Rate
4.5%
Mortgage Type
New Conventional
Estimated Equity
$168,512
Purchase Details
Closed on
Nov 25, 2013
Sold by
Davis Angela
Bought by
Larsen Kimberly A
Purchase Details
Closed on
Jan 11, 2013
Sold by
Secretary Of Hud
Bought by
Davis Angela
Home Financials for this Owner
Home Financials are based on the most recent Mortgage that was taken out on this home.
Original Mortgage
$81,937
Interest Rate
3.25%
Mortgage Type
FHA
Purchase Details
Closed on
May 3, 2012
Sold by
Jpmorgan Chase Bank Na
Bought by
Secretary Of Hud
Purchase Details
Closed on
Mar 28, 2012
Sold by
Hansen Jordan M and Hansen Melanie A
Bought by
Jpmorgan Chase Bank Na
Purchase Details
Closed on
May 18, 2007
Sold by
Hansen Jordan
Bought by
Hansen Jordan M and Hansen Melanie A
Home Financials for this Owner
Home Financials are based on the most recent Mortgage that was taken out on this home.
Original Mortgage
$124,450
Interest Rate
9.5%
Mortgage Type
Adjustable Rate Mortgage/ARM
Purchase Details
Closed on
Apr 27, 2005
Sold by
Hansen Jordan M
Bought by
Hansen Jordan M and Hansen Melanie A
Home Financials for this Owner
Home Financials are based on the most recent Mortgage that was taken out on this home.
Original Mortgage
$21,100
Interest Rate
5.92%
Mortgage Type
Stand Alone Second
Purchase Details
Closed on
Apr 22, 2005
Sold by
Kartchner Lloyd
Bought by
Hansen Jordan M
Home Financials for this Owner
Home Financials are based on the most recent Mortgage that was taken out on this home.
Original Mortgage
$21,100
Interest Rate
5.92%
Mortgage Type
Stand Alone Second
Create a Home Valuation Report for This Property
The Home Valuation Report is an in-depth analysis detailing your home's value as well as a comparison with similar homes in the area
Home Values in the Area
Average Home Value in this Area
Purchase History
| Date | Buyer | Sale Price | Title Company |
|---|---|---|---|
| Marble Cory | -- | First American Title Insuran | |
| Marble Cory | -- | Gt Title Services | |
| Larsen Kimberly A | -- | Inwest Title Tooele | |
| Davis Angela | -- | Cornerstone Title Insurance | |
| Secretary Of Hud | -- | None Available | |
| Jpmorgan Chase Bank Na | $147,431 | Etitle Insurance Agency | |
| Hansen Jordan M | -- | Atlas Title | |
| Hansen Jordan | -- | Atlas Title Heber City | |
| Hansen Jordan M | -- | Metro National Title | |
| Hansen Jordan M | -- | Metro National Title Co |
Source: Public Records
Mortgage History
| Date | Status | Borrower | Loan Amount |
|---|---|---|---|
| Open | Marble Cory | $172,175 | |
| Previous Owner | Davis Angela | $81,937 | |
| Previous Owner | Hansen Jordan | $124,450 | |
| Previous Owner | Hansen Jordan M | $21,100 |
Source: Public Records
Tax History Compared to Growth
Tax History
| Year | Tax Paid | Tax Assessment Tax Assessment Total Assessment is a certain percentage of the fair market value that is determined by local assessors to be the total taxable value of land and additions on the property. | Land | Improvement |
|---|---|---|---|---|
| 2025 | $2,006 | $293,961 | $73,000 | $220,961 |
| 2024 | $2,506 | $185,321 | $55,000 | $130,321 |
| 2023 | $2,506 | $176,767 | $36,300 | $140,467 |
| 2022 | $1,632 | $134,820 | $41,250 | $93,570 |
| 2021 | $1,922 | $132,060 | $13,750 | $118,310 |
| 2020 | $1,808 | $218,792 | $25,000 | $193,792 |
| 2019 | $1,429 | $171,140 | $17,284 | $153,856 |
| 2018 | $1,212 | $138,085 | $15,000 | $123,085 |
| 2017 | $941 | $126,895 | $15,000 | $111,895 |
| 2016 | $725 | $61,765 | $8,250 | $53,515 |
| 2015 | $725 | $51,448 | $0 | $0 |
| 2014 | -- | $51,448 | $0 | $0 |
Source: Public Records
Map
Nearby Homes
- 69 1930 N
- 81 W 1930 N
- 1909 N 70 W
- 1893 N 70 W
- 1893 N 70 W Unit 620
- 1885 N 70 W Unit 619
- 1877 N 70 W Unit 618
- 1861 N 70 W Unit 616
- 2057 N Loxley Dr
- 2065 N Loxley Dr
- Drysdale Twinhomes Plan at Drysdale Twinhomes
- 2117 N 170 W
- 1969 N 270 W
- 2177 N 130 W
- 1778 Brett St
- 2155 N 170 W
- 535 W 2030 N Unit 23
- 1913 N 370 W
- 61 W 1570 N
- 295 Drysdale Way