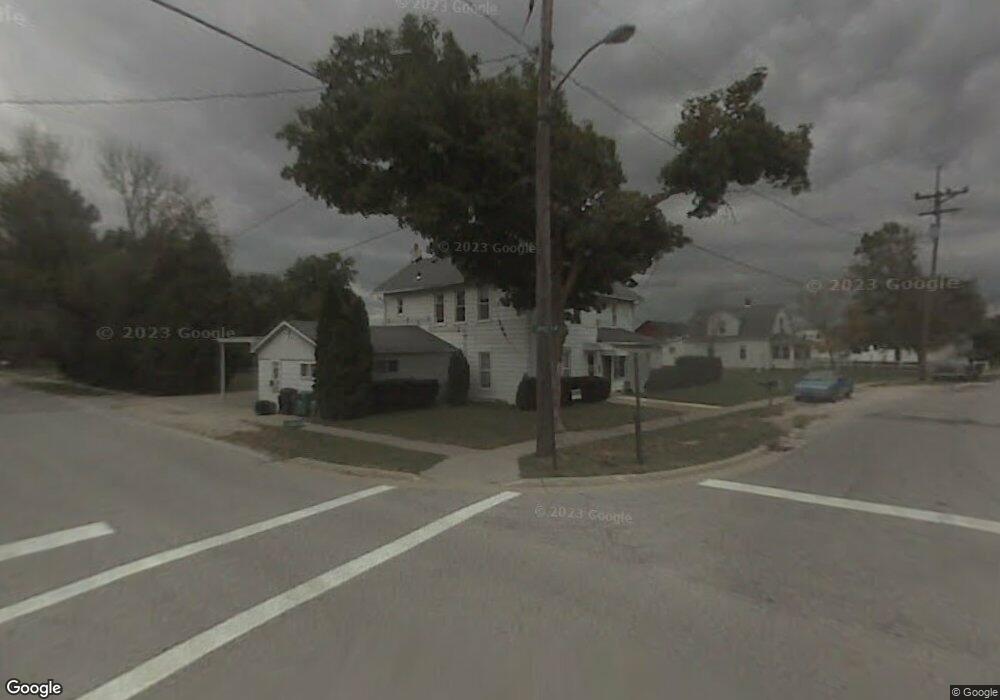
19520 W Curtice E and W Rd Curtice, OH 43412
Estimated Value: $345,000 - $372,685
3
Beds
3
Baths
2,400
Sq Ft
$148/Sq Ft
Est. Value
About This Home
This home is located at 19520 W Curtice E and W Rd, Curtice, OH 43412 and is currently estimated at $356,171, approximately $148 per square foot. 19520 W Curtice E and W Rd is a home located in Ottawa County with nearby schools including Genoa Elementary School.
Ownership History
Date
Name
Owned For
Owner Type
Purchase Details
Closed on
May 16, 2003
Sold by
Leu Richard
Bought by
Schulz Carl R and Schulz Kathryn
Current Estimated Value
Home Financials for this Owner
Home Financials are based on the most recent Mortgage that was taken out on this home.
Original Mortgage
$176,000
Interest Rate
5.87%
Mortgage Type
Purchase Money Mortgage
Create a Home Valuation Report for This Property
The Home Valuation Report is an in-depth analysis detailing your home's value as well as a comparison with similar homes in the area
Home Values in the Area
Average Home Value in this Area
Purchase History
| Date | Buyer | Sale Price | Title Company |
|---|---|---|---|
| Schulz Carl R | $220,000 | -- |
Source: Public Records
Mortgage History
| Date | Status | Borrower | Loan Amount |
|---|---|---|---|
| Previous Owner | Schulz Carl R | $176,000 |
Source: Public Records
Tax History Compared to Growth
Tax History
| Year | Tax Paid | Tax Assessment Tax Assessment Total Assessment is a certain percentage of the fair market value that is determined by local assessors to be the total taxable value of land and additions on the property. | Land | Improvement |
|---|---|---|---|---|
| 2024 | $3,984 | $98,823 | $17,056 | $81,767 |
| 2023 | $3,984 | $79,286 | $12,831 | $66,455 |
| 2022 | $3,545 | $79,286 | $12,831 | $66,455 |
| 2021 | $3,120 | $79,280 | $12,830 | $66,450 |
| 2020 | $2,959 | $72,410 | $8,850 | $63,560 |
| 2019 | $2,934 | $72,410 | $8,850 | $63,560 |
| 2018 | $2,902 | $72,410 | $8,850 | $63,560 |
| 2017 | $2,711 | $65,370 | $8,040 | $57,330 |
| 2016 | $2,775 | $65,370 | $8,040 | $57,330 |
| 2015 | $2,715 | $65,370 | $8,040 | $57,330 |
| 2014 | $1,174 | $62,500 | $8,040 | $54,460 |
| 2013 | $2,356 | $62,500 | $8,040 | $54,460 |
Source: Public Records
Map
Nearby Homes
- 7105 N Elliston Trowbridge Rd
- 445 S Yondota Rd
- 725 Donovan Rd
- 21224 W Toledo St
- 0 W Walbridge Rd
- Track 1 W Walbridge Rd
- 19367 W Walbridge Rd
- 9015 Seaman Rd
- 6927 N Wildacre Rd
- 7330 Jerusalem Rd
- 405 Lakemore Rd
- 434 Beachview Rd
- 549 Beachview Rd
- 11944 Corduroy Rd
- 645 Clubhouse Rd
- 11965 Dyke Rd
- 12404 La Fontaine Dr
- 12504 La Fontaine Dr
- 12369 Lagoon Dr
- 12403 Lagoon Dr
- 19521 W Curtice E and W Rd
- 19541 W Curtice E and W Rd
- 19456 W Curtice E and W Rd
- 19456 W Curtice E and W Rd
- 19550 W Curtice E and W Rd
- 19459 W Curtice E and W Rd
- 19565 W Curtice E and W Rd
- 19424 W Curtice E and W Rd
- 19565 Curtice East West Rd
- 19580 W Curtice E and W Rd
- 19429 W Curtice E and W Rd
- 19610 W Curtice E and W Rd
- 19396 W Curtice E and W Rd
- 19382 W Curtice E and W Rd
- 19639 W Curtice E and W Rd
- 19385 W Curtice E and W Rd
- 19385 W Curtice Rd
- 19640 W Curtice E and W Rd
- 19521 W
- 6901 N Opfer Lentz Rd