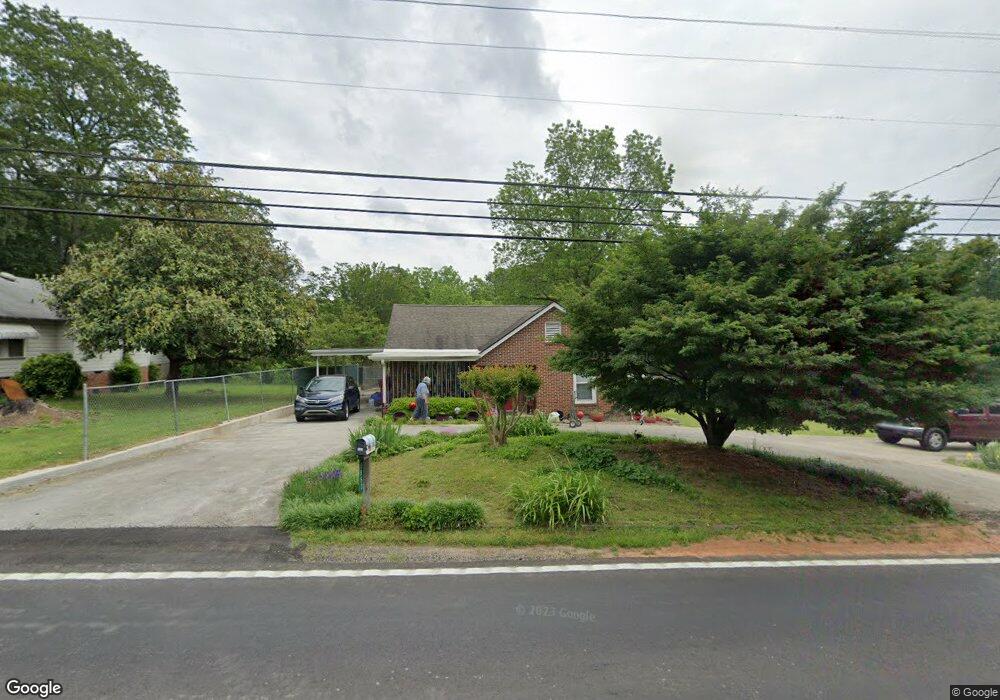
1953 W Currahee St Toccoa, GA 30577
Estimated Value: $142,000 - $278,000
2
Beds
1
Bath
1,357
Sq Ft
$142/Sq Ft
Est. Value
About This Home
This home is located at 1953 W Currahee St, Toccoa, GA 30577 and is currently estimated at $192,704, approximately $142 per square foot. 1953 W Currahee St is a home located in Stephens County with nearby schools including Stephens County High School.
Ownership History
Date
Name
Owned For
Owner Type
Purchase Details
Closed on
Jul 9, 2025
Sold by
Charles Jenna W
Bought by
Austin Jennifer Elaine Charles
Current Estimated Value
Purchase Details
Closed on
May 23, 1994
Sold by
Secretary Of Housing & Urban Development
Bought by
Charles Jenna W
Purchase Details
Closed on
Dec 13, 1993
Sold by
Independence One Mortgage Corporation
Bought by
Secretary Of Housing & Urban Development
Purchase Details
Closed on
Jul 11, 1989
Bought by
Oliver Jeffery Charles and Tammy Lynn
Purchase Details
Closed on
May 1, 1980
Sold by
Whiten Leona C
Bought by
Williams Emory H
Purchase Details
Closed on
Mar 30, 1979
Sold by
Whiten Joe H
Bought by
Whiten Leona C
Purchase Details
Closed on
Mar 12, 1979
Sold by
Whiten Joe H
Bought by
Whiten Leona C
Purchase Details
Closed on
Jul 24, 1950
Sold by
Jordan Hoke S
Bought by
Whiten Joe
Purchase Details
Closed on
Oct 16, 1944
Sold by
Terrell Clark Mrs
Bought by
Whiten Joe H
Create a Home Valuation Report for This Property
The Home Valuation Report is an in-depth analysis detailing your home's value as well as a comparison with similar homes in the area
Home Values in the Area
Average Home Value in this Area
Purchase History
| Date | Buyer | Sale Price | Title Company |
|---|---|---|---|
| Austin Jennifer Elaine Charles | -- | -- | |
| Charles Jenna W | $41,200 | -- | |
| Secretary Of Housing & Urban Development | $47,000 | -- | |
| Independence One Mortgage Corporation | -- | -- | |
| Independence One Mortgage Corporation | $47,000 | -- | |
| Oliver Jeffery Charles | $47,400 | -- | |
| Williams Emory H | $35,000 | -- | |
| Whiten Leona C | -- | -- | |
| Whiten Leona C | -- | -- | |
| Whiten Joe | $200 | -- | |
| Whiten Joe H | -- | -- |
Source: Public Records
Tax History Compared to Growth
Tax History
| Year | Tax Paid | Tax Assessment Tax Assessment Total Assessment is a certain percentage of the fair market value that is determined by local assessors to be the total taxable value of land and additions on the property. | Land | Improvement |
|---|---|---|---|---|
| 2024 | $27 | $34,594 | $3,482 | $31,112 |
| 2023 | $6 | $32,368 | $3,482 | $28,886 |
| 2022 | $903 | $30,343 | $3,482 | $26,861 |
| 2021 | $840 | $26,867 | $3,482 | $23,385 |
| 2020 | $825 | $26,134 | $3,482 | $22,652 |
| 2019 | $828 | $26,117 | $3,482 | $22,635 |
| 2018 | $0 | $25,918 | $3,482 | $22,436 |
| 2017 | $0 | $25,918 | $3,482 | $22,436 |
| 2016 | $0 | $25,917 | $3,481 | $22,436 |
| 2015 | -- | $25,685 | $3,481 | $22,203 |
| 2014 | -- | $25,685 | $3,482 | $22,204 |
| 2013 | -- | $25,241 | $3,481 | $21,760 |
Source: Public Records
Map
Nearby Homes
- 1923 W Currahee St
- 1967 W Currahee St
- 1903 W Currahee St
- 1942 W Currahee St
- 1942 W Currahee St Unit 4028
- 2003 W Currahee St
- 2003 W Currahee St
- 1982 W Currahee St
- 1908 W Currahee St
- 1879 W Currahee St
- 1992 W Currahee St
- 1894 W Currahee St
- 1964 W Currahee St
- 1892 W Currahee St
- 45 Rumsey Row Dr
- 21 Rumsey Row Dr
- 2021 W Currahee St
- 1875 W Currahee St
- 1874 W Currahee St
- 0000 W Currahee St