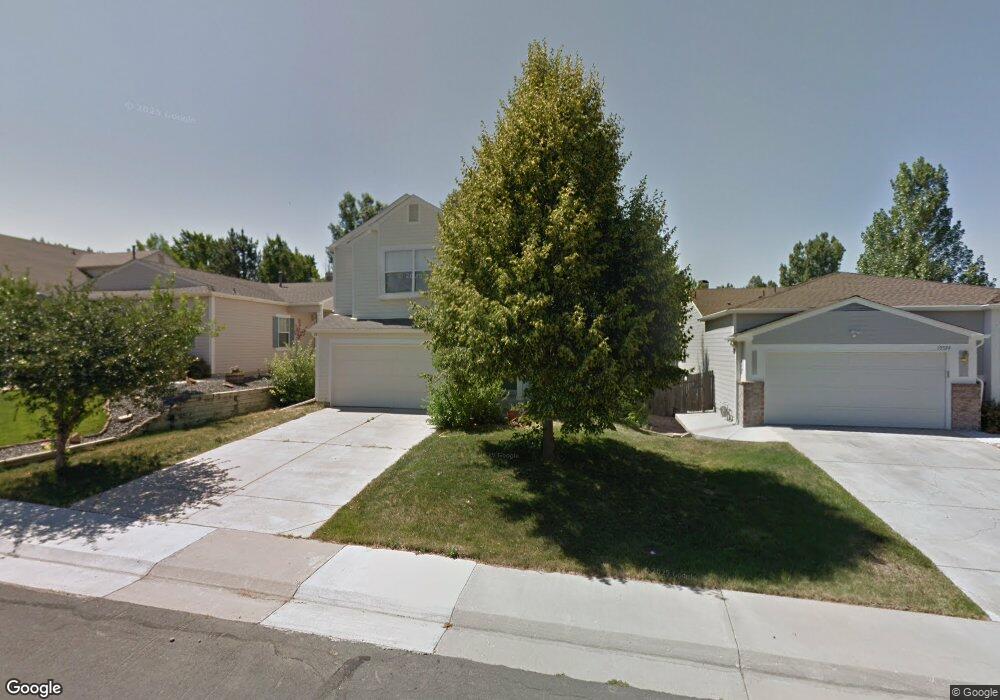
19534 E Ithaca Place Aurora, CO 80013
Ridgeview Glen NeighborhoodEstimated Value: $512,882 - $565,000
4
Beds
4
Baths
1,994
Sq Ft
$269/Sq Ft
Est. Value
About This Home
This home is located at 19534 E Ithaca Place, Aurora, CO 80013 and is currently estimated at $535,971, approximately $268 per square foot. 19534 E Ithaca Place is a home located in Arapahoe County with nearby schools including Sunrise Elementary School, Horizon Middle School, and Smoky Hill High School.
Ownership History
Date
Name
Owned For
Owner Type
Purchase Details
Closed on
Jan 8, 2003
Sold by
Wang Zhu Li and Zhong Mei Yue
Bought by
Wang Zhu L and Zhong Mei Y
Current Estimated Value
Home Financials for this Owner
Home Financials are based on the most recent Mortgage that was taken out on this home.
Original Mortgage
$150,000
Interest Rate
6%
Purchase Details
Closed on
Oct 5, 1999
Sold by
Schultz Frederic K and Schultz Debra M
Bought by
Wang Zhu Li and Zhong Mei Yue
Home Financials for this Owner
Home Financials are based on the most recent Mortgage that was taken out on this home.
Original Mortgage
$156,800
Interest Rate
7.83%
Mortgage Type
Stand Alone First
Purchase Details
Closed on
Aug 30, 1995
Sold by
Pulte Home Corp
Bought by
Schultz Frederic K and Schultz Debra M
Home Financials for this Owner
Home Financials are based on the most recent Mortgage that was taken out on this home.
Original Mortgage
$149,800
Interest Rate
7.6%
Create a Home Valuation Report for This Property
The Home Valuation Report is an in-depth analysis detailing your home's value as well as a comparison with similar homes in the area
Home Values in the Area
Average Home Value in this Area
Purchase History
| Date | Buyer | Sale Price | Title Company |
|---|---|---|---|
| Wang Zhu L | -- | -- | |
| Wang Zhu Li | $196,000 | Land Title | |
| Schultz Frederic K | $157,710 | Land Title |
Source: Public Records
Mortgage History
| Date | Status | Borrower | Loan Amount |
|---|---|---|---|
| Closed | Wang Zhu L | $150,000 | |
| Closed | Wang Zhu Li | $156,800 | |
| Previous Owner | Schultz Frederic K | $149,800 |
Source: Public Records
Tax History
| Year | Tax Paid | Tax Assessment Tax Assessment Total Assessment is a certain percentage of the fair market value that is determined by local assessors to be the total taxable value of land and additions on the property. | Land | Improvement |
|---|---|---|---|---|
| 2025 | $2,746 | $35,200 | -- | -- |
| 2024 | $2,421 | $35,001 | -- | -- |
| 2023 | $2,421 | $35,001 | $0 | $0 |
| 2022 | $1,944 | $26,841 | $0 | $0 |
| 2021 | $1,956 | $26,841 | $0 | $0 |
| 2020 | $1,949 | $27,141 | $0 | $0 |
| 2019 | $1,880 | $27,141 | $0 | $0 |
| 2018 | $1,652 | $22,414 | $0 | $0 |
| 2017 | $1,629 | $22,414 | $0 | $0 |
| 2016 | $1,604 | $20,704 | $0 | $0 |
| 2015 | $1,527 | $20,704 | $0 | $0 |
| 2014 | $1,305 | $15,673 | $0 | $0 |
| 2013 | -- | $16,350 | $0 | $0 |
Source: Public Records
Map
Nearby Homes
- 3637 S Fundy Way
- 3667 S Flanders St
- 19695 E Hamilton Place
- 3528 S Fundy Ct
- 19152 E Hampden Dr
- 3742 S Ensenada St
- 3752 S Genoa Cir Unit B
- 3771 S Danube Cir
- 3817 S Ceylon Way
- 3770 S Genoa Cir Unit D
- 3796 S Ceylon Way
- 3519 S Cathay St
- 3793 S Ceylon Way
- 19462 E Milan Cir
- 3247 S Ensenada Way
- 18947 E Mercer Dr
- 3696 S Argonne St
- 18967 E Mercer Dr
- 3257 S Biscay Way
- 20473 E Girard Dr
- 19544 E Ithaca Place
- 19524 E Ithaca Place
- 19554 E Ithaca Place
- 3643 S Flanders St
- 3641 S Flanders St
- 19564 E Ithaca Place
- 3645 S Flanders St
- 3635 S Flanders St
- 19533 E Ithaca Place
- 19523 E Ithaca Place
- 3633 S Flanders St
- 19543 E Ithaca Place
- 19574 E Ithaca Place
- 19553 E Ithaca Place
- 3651 S Flanders St
- 3631 S Flanders St
- 19499 E Ithaca Place
- 19584 E Ithaca Place
- 3644 S Flanders St
- 3625 S Flanders St
Your Personal Tour Guide
Ask me questions while you tour the home.