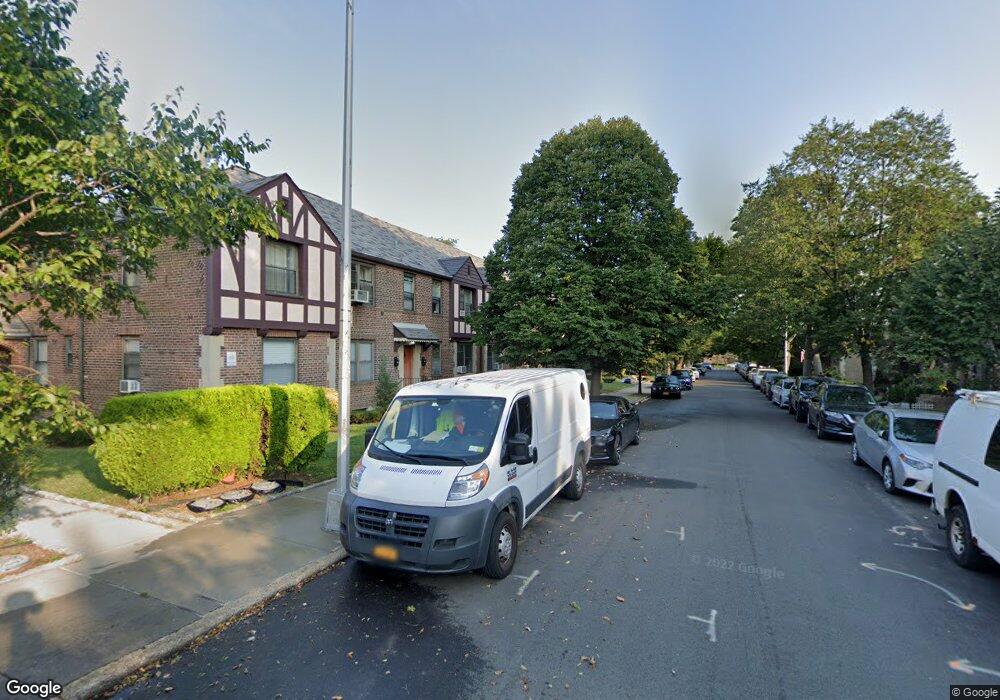
1954 79th St Unit 1 East Elmhurst, NY 11370
Ditmars Steinway NeighborhoodEstimated Value: $378,000 - $525,000
--
Bed
--
Bath
772
Sq Ft
$592/Sq Ft
Est. Value
About This Home
This home is located at 1954 79th St Unit 1, East Elmhurst, NY 11370 and is currently estimated at $457,165, approximately $592 per square foot. 1954 79th St Unit 1 is a home located in Queens County with nearby schools including P.S. 2 Alfred Zimberg, Is 141 The Steinway, and William Cullen Bryant High School.
Ownership History
Date
Name
Owned For
Owner Type
Purchase Details
Closed on
Oct 19, 2011
Sold by
Mostafa Yasser
Bought by
El Kassar Susan
Current Estimated Value
Purchase Details
Closed on
Apr 12, 2005
Sold by
Banos Luis M
Bought by
Yasser Mostafa
Home Financials for this Owner
Home Financials are based on the most recent Mortgage that was taken out on this home.
Original Mortgage
$256,000
Interest Rate
5.95%
Mortgage Type
Purchase Money Mortgage
Purchase Details
Closed on
Nov 1, 1999
Sold by
Rodriguez John
Bought by
Banos Luis
Home Financials for this Owner
Home Financials are based on the most recent Mortgage that was taken out on this home.
Original Mortgage
$44,500
Interest Rate
7.71%
Purchase Details
Closed on
Feb 24, 1998
Sold by
Gonzalez Jorge
Bought by
Rodriguez John
Home Financials for this Owner
Home Financials are based on the most recent Mortgage that was taken out on this home.
Original Mortgage
$91,200
Interest Rate
6.92%
Create a Home Valuation Report for This Property
The Home Valuation Report is an in-depth analysis detailing your home's value as well as a comparison with similar homes in the area
Home Values in the Area
Average Home Value in this Area
Purchase History
| Date | Buyer | Sale Price | Title Company |
|---|---|---|---|
| El Kassar Susan | -- | -- | |
| Yasser Mostafa | $320,000 | -- | |
| Banos Luis | $94,500 | Fidelity National Title Ins | |
| Rodriguez John | $96,000 | -- | |
| Gonzalez Jorge | $75,000 | Commonwealth Land Title Ins |
Source: Public Records
Mortgage History
| Date | Status | Borrower | Loan Amount |
|---|---|---|---|
| Previous Owner | Yasser Mostafa | $256,000 | |
| Previous Owner | Banos Luis | $44,500 | |
| Previous Owner | Gonzalez Jorge | $91,200 |
Source: Public Records
Tax History Compared to Growth
Tax History
| Year | Tax Paid | Tax Assessment Tax Assessment Total Assessment is a certain percentage of the fair market value that is determined by local assessors to be the total taxable value of land and additions on the property. | Land | Improvement |
|---|---|---|---|---|
| 2025 | $3,164 | $31,843 | $7,366 | $24,477 |
| 2024 | $2,375 | $31,595 | $7,366 | $24,229 |
| 2023 | $3,166 | $31,615 | $7,366 | $24,249 |
| 2022 | $2,300 | $31,434 | $7,366 | $24,068 |
| 2021 | $2,120 | $29,315 | $7,366 | $21,949 |
| 2020 | $2,186 | $33,166 | $7,366 | $25,800 |
| 2019 | $1,991 | $34,019 | $7,366 | $26,653 |
| 2018 | $938 | $24,922 | $7,366 | $17,556 |
| 2017 | $2,756 | $23,388 | $7,366 | $16,022 |
| 2016 | $2,583 | $23,388 | $7,366 | $16,022 |
| 2015 | $1,485 | $21,332 | $7,366 | $13,966 |
| 2014 | $1,485 | $20,524 | $7,366 | $13,158 |
Source: Public Records
Map
Nearby Homes
- 1950 80th St Unit 1
- 19-50 80th St Unit 1
- 19-49 80th St
- 19-65 79th St Unit 2C
- 7916 19th Rd Unit 2
- 19-44 78th St
- 1956 81st St
- 80-18 19th Ave Unit 1
- 21-14 80th St
- 21-16 77 Street 2nd Floor
- 21-43 80th St
- 21-40 78th St Unit 2
- 2205 80th St
- 76-12 Ditmars Blvd Unit B3
- 2220 78th St Unit A3
- 22-39 78 St
- 2209 76th St Unit C2
- 2208 76th St Unit A3
- 22-27 76 St Unit B2
- 22-40 80th St Unit 2B
- 1952 79th St Unit 2
- 1952 79th St Unit 1
- 1954 79th St Unit 2
- 19-52 79th St
- 19-54 79th St Unit 1-FL
- 19-58 79th St Unit 2
- 1956 79th St Unit 2
- 1956 79th St Unit 1
- 1958 79th St Unit 2
- 1958 79th St Unit 1
- 1958 79th St Unit 2
- 1956 79th St
- 19-58 79th St
- 19-58 79th St Unit 2B2
- 19-56 79th St Unit 1
- 1950 79th St
- 1950 79th St Unit 2
- 1950 79th St Unit 1
- 19-50 79th St Unit 1
- 19-50 79th St