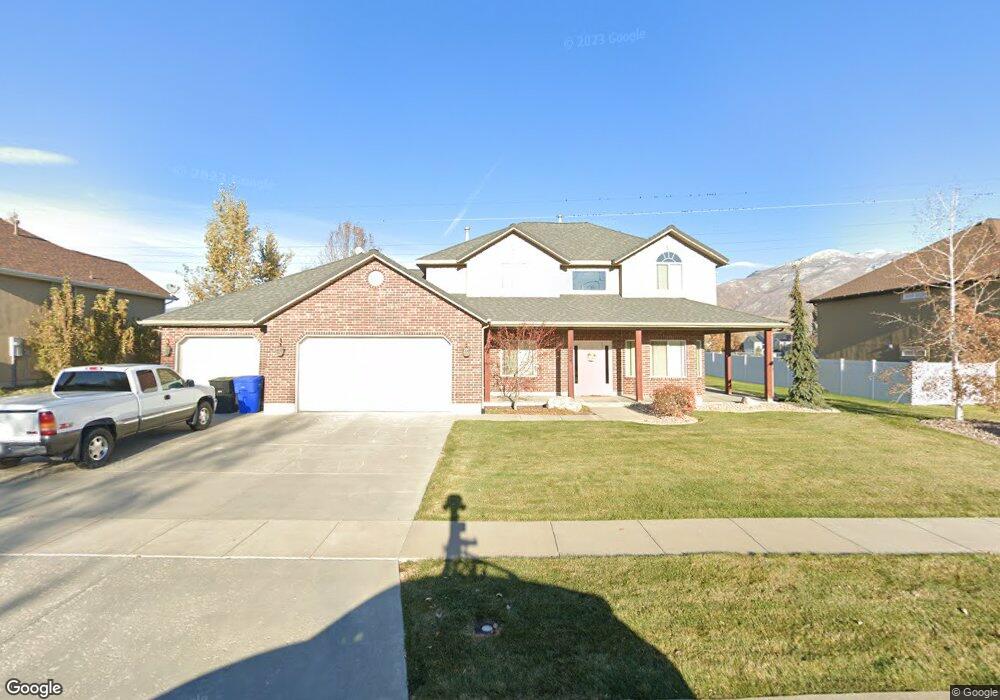
1954 Ranch Rd Farmington, UT 84025
Estimated Value: $744,000 - $851,000
5
Beds
3
Baths
2,638
Sq Ft
$299/Sq Ft
Est. Value
About This Home
This home is located at 1954 Ranch Rd, Farmington, UT 84025 and is currently estimated at $788,032, approximately $298 per square foot. 1954 Ranch Rd is a home located in Davis County with nearby schools including Eagle Bay Elementary School, Farmington High, and Farmington Junior High School.
Ownership History
Date
Name
Owned For
Owner Type
Purchase Details
Closed on
Apr 26, 2013
Sold by
Young Darin
Bought by
Young Darin and Young Susan
Current Estimated Value
Home Financials for this Owner
Home Financials are based on the most recent Mortgage that was taken out on this home.
Original Mortgage
$224,900
Outstanding Balance
$159,680
Interest Rate
3.6%
Mortgage Type
New Conventional
Estimated Equity
$628,352
Purchase Details
Closed on
Aug 18, 2005
Sold by
Rigby Construction Inc
Bought by
Leavitt Jason D and Leavitt Jana Lee
Home Financials for this Owner
Home Financials are based on the most recent Mortgage that was taken out on this home.
Original Mortgage
$29,900
Interest Rate
7%
Mortgage Type
Unknown
Purchase Details
Closed on
Feb 1, 2005
Sold by
Landrum Michael J
Bought by
Rigby Construction Inc
Purchase Details
Closed on
Aug 12, 2004
Sold by
Boyer Wheeler Farm Lc
Bought by
Landrum Michael J
Create a Home Valuation Report for This Property
The Home Valuation Report is an in-depth analysis detailing your home's value as well as a comparison with similar homes in the area
Home Values in the Area
Average Home Value in this Area
Purchase History
| Date | Buyer | Sale Price | Title Company |
|---|---|---|---|
| Young Darin | -- | North American Title | |
| Young Darin | -- | North American Title | |
| Leavitt Jason D | -- | Bonneville Title Company | |
| Rigby Construction Inc | -- | Bonneville Title Company | |
| Landrum Michael J | -- | Bonneville Title Company Inc |
Source: Public Records
Mortgage History
| Date | Status | Borrower | Loan Amount |
|---|---|---|---|
| Open | Young Darin | $224,900 | |
| Previous Owner | Leavitt Jason D | $29,900 | |
| Previous Owner | Leavitt Jason D | $239,920 |
Source: Public Records
Tax History Compared to Growth
Tax History
| Year | Tax Paid | Tax Assessment Tax Assessment Total Assessment is a certain percentage of the fair market value that is determined by local assessors to be the total taxable value of land and additions on the property. | Land | Improvement |
|---|---|---|---|---|
| 2025 | $3,695 | $334,950 | $188,055 | $146,895 |
| 2024 | $3,723 | $347,600 | $186,614 | $160,986 |
| 2023 | $3,601 | $621,000 | $288,255 | $332,745 |
| 2022 | $3,537 | $344,850 | $155,842 | $189,008 |
| 2021 | $3,227 | $467,000 | $183,346 | $283,654 |
| 2020 | $2,941 | $414,000 | $146,705 | $267,295 |
| 2019 | $2,914 | $401,000 | $150,406 | $250,594 |
| 2018 | $2,762 | $375,000 | $137,924 | $237,076 |
| 2016 | $2,523 | $181,610 | $57,143 | $124,467 |
| 2015 | $2,449 | $169,015 | $57,143 | $111,872 |
| 2014 | $2,351 | $168,542 | $43,816 | $124,726 |
| 2013 | -- | $175,563 | $46,785 | $128,778 |
Source: Public Records
Map
Nearby Homes
- Harvard Plan at Eastridge Estates
- Fortissimo Plan at Eastridge Estates
- Crescendo Plan at Eastridge Estates
- Browning Plan at Eastridge Estates
- Adagio Plan at Eastridge Estates
- Harrison Plan at Eastridge Estates
- Timpani Plan at Eastridge Estates
- Ballad Plan at Eastridge Estates
- Anthem Plan at Eastridge Estates
- Bravo Plan at Eastridge Estates
- Canon Plan at Eastridge Estates
- Treble Plan at Eastridge Estates
- Madrigal Plan at Eastridge Estates
- Trio Plan at Eastridge Estates
- Tempo Plan at Eastridge Estates
- Tenor Plan at Eastridge Estates
- Interlude Plan at Eastridge Estates
- Octave Plan at Eastridge Estates
- Accord Plan at Eastridge Estates
- Finale Plan at Eastridge Estates
- 1954 W Ranch Rd
- 1964 W Ranch Rd
- 1938 Ranch Rd
- 1938 W Ranch Rd
- 1964 Ranch Rd
- 1926 Ranch Rd
- 1926 W Ranch Rd
- 1951 W Ranch Rd
- 1951 Ranch Rd
- 1983 Ranch Rd
- 88 Countryside Rd
- 1902 Ranch Rd
- 31 Countryside Rd
- 1993 Ranch Rd
- 1996 W Ranch Rd
- 1996 Ranch Rd
- 1886 Ranch Rd
- 23 Countryside Rd
- 1886 W Ranch Rd
- 23 S Countryside Rd