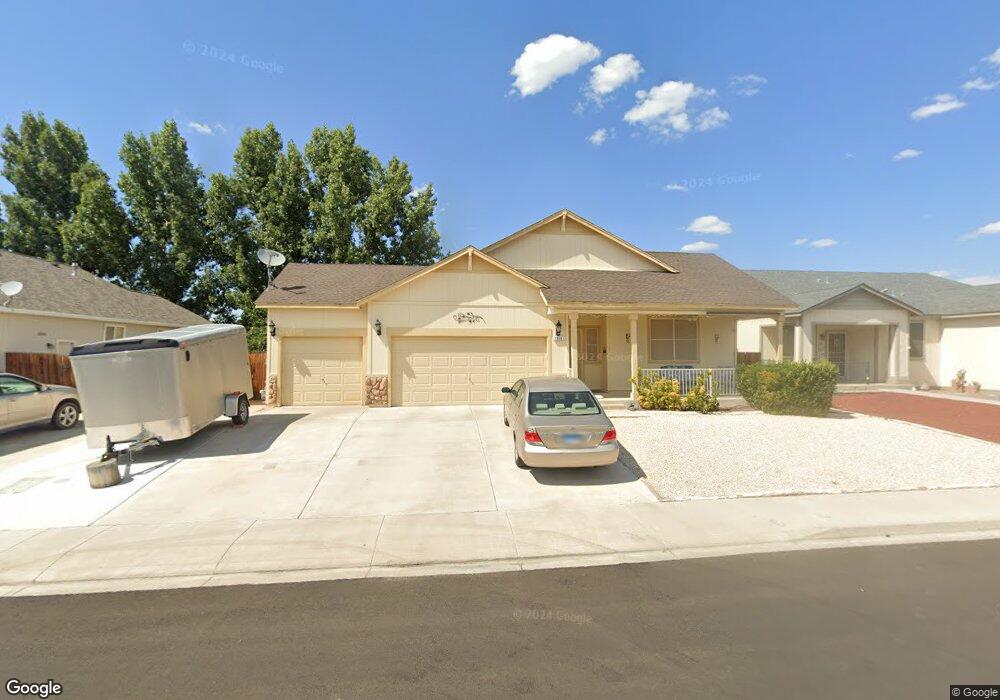
1954 Rawles Dr Unit 6 Fernley, NV 89408
Estimated Value: $410,568 - $440,000
4
Beds
2
Baths
2,049
Sq Ft
$207/Sq Ft
Est. Value
About This Home
This home is located at 1954 Rawles Dr Unit 6, Fernley, NV 89408 and is currently estimated at $425,142, approximately $207 per square foot. 1954 Rawles Dr Unit 6 is a home located in Lyon County with nearby schools including Cottonwood Elementary School, Fernley Intermediate School, and Fernley High School.
Ownership History
Date
Name
Owned For
Owner Type
Purchase Details
Closed on
Aug 12, 2014
Sold by
Sage Valley Ventures Inc
Bought by
Cothran Larry E and Cothran Dianna L
Current Estimated Value
Purchase Details
Closed on
May 15, 2014
Sold by
Jpmorgan Chase Bank Na
Bought by
Sage Valley Ventures Inc
Purchase Details
Closed on
Jan 13, 2014
Sold by
Smith John T and Smith April Lea
Bought by
Jpmorgan Chase Bank Na
Purchase Details
Closed on
Mar 16, 2011
Sold by
Federal National Mortgage Association
Bought by
Smith John T and Smith April Lea
Home Financials for this Owner
Home Financials are based on the most recent Mortgage that was taken out on this home.
Original Mortgage
$139,896
Interest Rate
4.77%
Mortgage Type
New Conventional
Purchase Details
Closed on
Sep 15, 2010
Sold by
Wetzel Doreen A
Bought by
Federal National Mortgage Association and Fannie Mae
Create a Home Valuation Report for This Property
The Home Valuation Report is an in-depth analysis detailing your home's value as well as a comparison with similar homes in the area
Home Values in the Area
Average Home Value in this Area
Purchase History
| Date | Buyer | Sale Price | Title Company |
|---|---|---|---|
| Cothran Larry E | $193,000 | Western Title Co | |
| Sage Valley Ventures Inc | $152,500 | Western Title Co | |
| Jpmorgan Chase Bank Na | $154,120 | Lsi Title Agency Inc | |
| Smith John T | $135,000 | Servicelink | |
| Federal National Mortgage Association | $222,744 | Lsi Title Agency Inc |
Source: Public Records
Mortgage History
| Date | Status | Borrower | Loan Amount |
|---|---|---|---|
| Previous Owner | Smith John T | $139,896 |
Source: Public Records
Tax History Compared to Growth
Tax History
| Year | Tax Paid | Tax Assessment Tax Assessment Total Assessment is a certain percentage of the fair market value that is determined by local assessors to be the total taxable value of land and additions on the property. | Land | Improvement |
|---|---|---|---|---|
| 2025 | $1,962 | $122,789 | $43,750 | $79,039 |
| 2024 | $2,314 | $123,200 | $43,750 | $79,450 |
| 2023 | $2,314 | $118,221 | $43,750 | $74,471 |
| 2022 | $2,174 | $112,695 | $43,750 | $68,945 |
| 2021 | $2,148 | $98,219 | $30,800 | $67,419 |
| 2020 | $2,092 | $95,041 | $30,800 | $64,241 |
| 2019 | $2,060 | $89,812 | $28,000 | $61,812 |
| 2018 | $2,015 | $81,326 | $21,000 | $60,326 |
| 2017 | $2,001 | $73,439 | $13,130 | $60,309 |
| 2016 | $1,806 | $60,969 | $5,780 | $55,189 |
| 2015 | $1,840 | $40,970 | $5,780 | $35,190 |
| 2014 | $1,797 | $38,366 | $5,780 | $32,586 |
Source: Public Records
Map
Nearby Homes
- 1409 Jennys Ln
- 1625 Picetti Way
- 1740 Johns Cir
- 1563 Maria Ct
- 1285 Camille Dr
- 1616 Laverder Dr
- 1165 Jenny's Ln
- 1300 Rancho Rd
- 1315 Winnies Ln
- 1671 Vista Moon Ct
- 1353 Winnies Ln
- 1405 Buckboard Way
- 1240-1250 Farm District Rd
- 2605 Emerson Cir
- 675 Warren Way
- 870 Jennys Ln
- 863 Jennys Ln
- 1165 Farm Ln
- 698 Jenny's Ln
- 1687 Round up Rd
- 1954 W Rawles Dr
- 1950 W Rawles Dr
- 1950 Rawles Dr
- 1958 Rawles Dr Unit 6
- 1603 Picetti Way
- 1601 Picetti Way
- 1962 Rawles Dr
- 1946 W Rawles Dr
- 1962 W Rawles Dr
- 1946 Rawles Dr Unit 4
- 1605 Picetti Way
- 1955 Rawles Dr
- 1955 W Rawles Dr
- 1959 Rawles Dr
- 1951 W Rawles Dr
- 1951 Rawles Dr
- 1959 W Rawles Dr
- 1966 Rawles Dr
- 1966 W Rawles Dr
- 1426 Jennys Ln