Estimated Value: $340,001 - $448,000
3
Beds
1
Bath
1,394
Sq Ft
$291/Sq Ft
Est. Value
About This Home
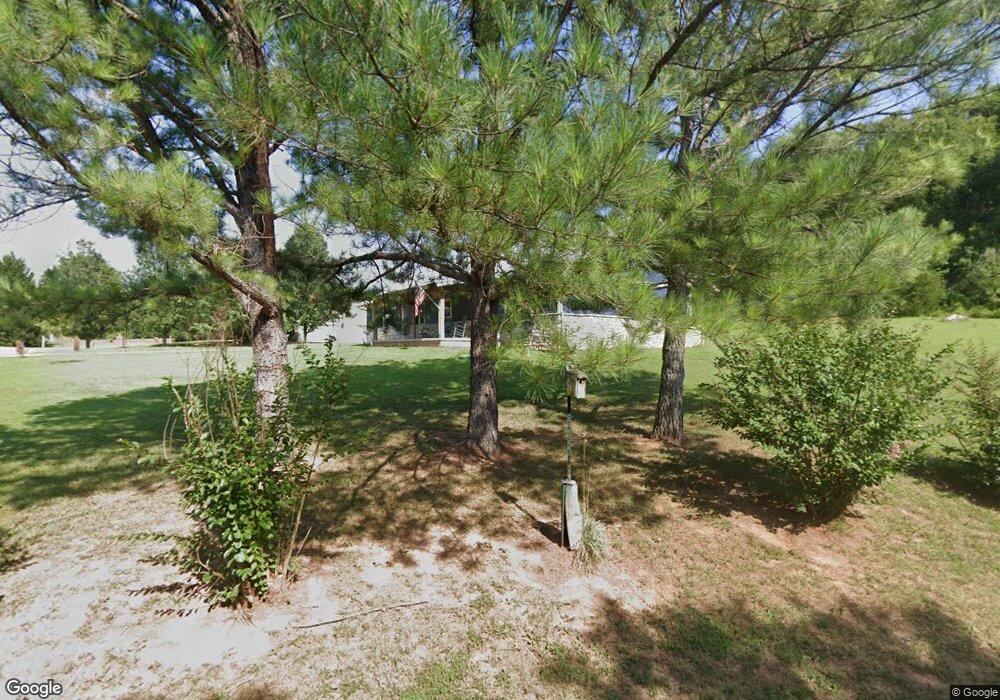
This home is located at 1954 W Patton Place, Nixa, MO 65714 and is currently estimated at $405,500, approximately $290 per square foot. 1954 W Patton Place is a home with nearby schools including Espy Elementary School, Nicholas A. Inman Intermediate School, and Nixa Junior High School.
Ownership History
Date
Name
Owned For
Owner Type
Purchase Details
Closed on
Dec 7, 2020
Sold by
Townsend William and Townsend Tracy
Bought by
Townsend Robert
Current Estimated Value
Home Financials for this Owner
Home Financials are based on the most recent Mortgage that was taken out on this home.
Original Mortgage
$150,000
Interest Rate
2.8%
Mortgage Type
Construction
Purchase Details
Closed on
May 20, 2020
Sold by
Pearce Gregory S
Bought by
Townsend William and Townsend Tracy
Home Financials for this Owner
Home Financials are based on the most recent Mortgage that was taken out on this home.
Original Mortgage
$18,000
Interest Rate
3.3%
Mortgage Type
Credit Line Revolving
Purchase Details
Closed on
Jun 3, 2015
Sold by
Pearce Janice K
Bought by
Pearce Gregory S
Purchase Details
Closed on
Jan 23, 2015
Sold by
Vandergrift Nathan C
Bought by
Pearce Janice K
Purchase Details
Closed on
May 13, 2009
Sold by
Pitt William A
Bought by
Vandergrift Nathan C
Create a Home Valuation Report for This Property
The Home Valuation Report is an in-depth analysis detailing your home's value as well as a comparison with similar homes in the area
Purchase History
| Date | Buyer | Sale Price | Title Company |
|---|---|---|---|
| Townsend Robert | -- | Great Amer Ttl All Branches | |
| Townsend William | -- | Great Amer Ttl All Branches | |
| Pearce Gregory S | -- | Great American Title | |
| Pearce Janice K | -- | Great American Title | |
| Vandergrift Nathan C | -- | None Available |
Source: Public Records
Mortgage History
| Date | Status | Borrower | Loan Amount |
|---|---|---|---|
| Closed | Townsend Robert | $150,000 | |
| Closed | Townsend William | $18,000 |
Source: Public Records
Tax History
| Year | Tax Paid | Tax Assessment Tax Assessment Total Assessment is a certain percentage of the fair market value that is determined by local assessors to be the total taxable value of land and additions on the property. | Land | Improvement |
|---|---|---|---|---|
| 2025 | $2,731 | $49,120 | -- | -- |
| 2024 | $3,456 | $46,020 | -- | -- |
| 2023 | $3,456 | $58,240 | -- | -- |
| 2022 | $3,341 | $56,240 | $0 | $0 |
| 2021 | $221 | $3,710 | $0 | $0 |
| 2020 | $231 | $3,710 | $0 | $0 |
| 2019 | $231 | $3,710 | $0 | $0 |
| 2018 | $214 | $3,710 | $0 | $0 |
| 2017 | $214 | $3,710 | $0 | $0 |
| 2016 | $210 | $3,710 | $0 | $0 |
| 2015 | $211 | $3,710 | $3,710 | $0 |
| 2014 | $205 | $3,710 | $0 | $0 |
| 2013 | $2 | $3,710 | $0 | $0 |
| 2011 | $2 | $7,420 | $0 | $0 |
Source: Public Records
Map
Nearby Homes
- 3396 W Bluffview St
- 1661 N Old Burr Oak Ct
- 3182 W Bluffview St
- 3262 W Bluffview St
- 3338 W Springview St
- 3260 W Rivulet Pass
- 2025 N Equestrian Ln
- 3240 W Bluffview St
- 3239 W Bluffview St
- 3232 W Bluffview St
- 1518 Coach House Ct
- 3231 W Bluffview St
- 3224 W Bluffview St
- 1518 W Stagecoach Ct
- 1522 W Porterfield Dr
- 4930 S State Route Ff
- 2069 Preakness Dr
- 6046 S Parkhaven Ln
- 4152 W Sycamore Dr
- 4064 Sycamore Dr Unit Lot 145
- 0 W Patton Place Unit 11200664
- 000 W Patton Place
- 1932 W Patton Place
- 1943 W Patton Place
- 1957 W Patton Place
- 1961 W Patton Place
- 1935 W Patton Place
- 1922 W Patton Place
- 1951 W Patton Place
- 1929 W Patton Place
- 1975 W Patton Place
- 000 Patton
- 1863 N Phillips Rd
- 1937 Phillips Rd
- 1983 W Patton Place
- 1882 N South Brook Ct
- 1978 Phillips Rd
- 1881 N Suncrest Ct
- 1858 N Phillips Rd
- 1873 Hillview Dr
Your Personal Tour Guide
Ask me questions while you tour the home.