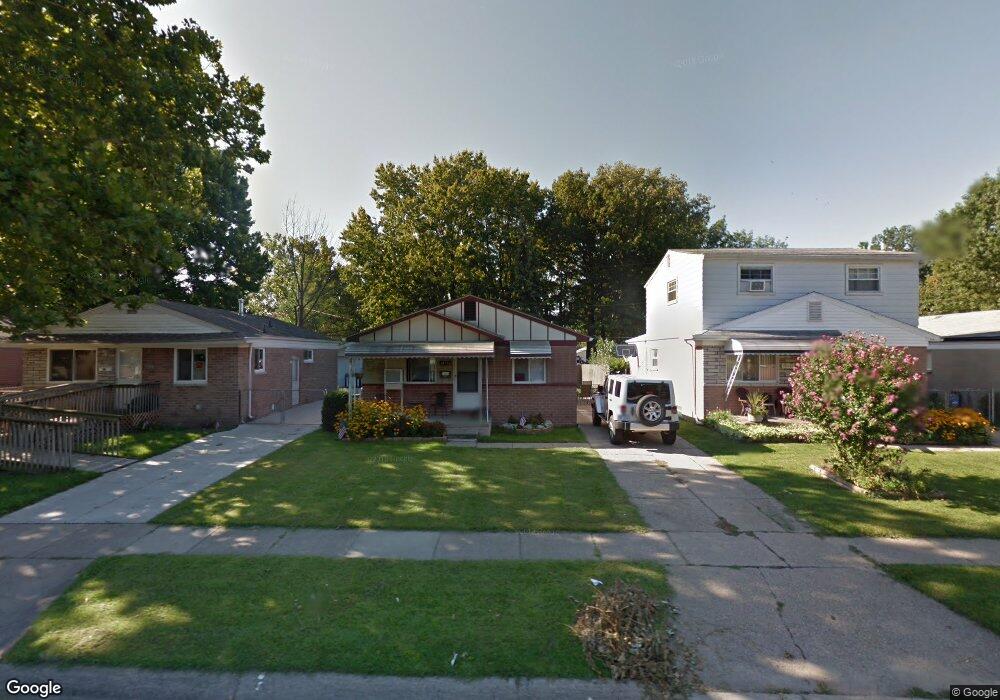
19550 Colman St Unit Bldg-Unit Clinton Township, MI 48035
Estimated Value: $163,592 - $172,000
3
Beds
2
Baths
875
Sq Ft
$191/Sq Ft
Est. Value
About This Home
This home is located at 19550 Colman St Unit Bldg-Unit, Clinton Township, MI 48035 and is currently estimated at $167,398, approximately $191 per square foot. 19550 Colman St Unit Bldg-Unit is a home located in Macomb County with nearby schools including Clintondale High School and Arts Academy in the Woods.
Ownership History
Date
Name
Owned For
Owner Type
Purchase Details
Closed on
May 31, 2018
Sold by
William D Cooper Revocable Trust
Bought by
Koester Donald and Beauchamp Samantha
Current Estimated Value
Home Financials for this Owner
Home Financials are based on the most recent Mortgage that was taken out on this home.
Original Mortgage
$64,000
Outstanding Balance
$55,349
Interest Rate
4.5%
Mortgage Type
New Conventional
Estimated Equity
$112,049
Purchase Details
Closed on
Jan 7, 2013
Sold by
Cooper William D
Bought by
Cooper William D and William D Cooper Revocable Tru
Purchase Details
Closed on
Apr 13, 2007
Sold by
Narmore Kathy and Narmore Leonard
Bought by
Deutsche Bank National Trust Co and Ffmlt Trust 2005-Ff8 Mortgage Pass Throu
Purchase Details
Closed on
Mar 26, 2001
Sold by
Ward Melvin J
Bought by
Narmore Leonard
Purchase Details
Closed on
Mar 6, 1998
Sold by
Ward M D
Bought by
Narmore L K
Create a Home Valuation Report for This Property
The Home Valuation Report is an in-depth analysis detailing your home's value as well as a comparison with similar homes in the area
Home Values in the Area
Average Home Value in this Area
Purchase History
| Date | Buyer | Sale Price | Title Company |
|---|---|---|---|
| Koester Donald | $114,000 | None Available | |
| Cooper William D | -- | None Available | |
| Deutsche Bank National Trust Co | $93,932 | None Available | |
| Narmore Leonard | $65,350 | -- | |
| Narmore L K | $65,350 | -- |
Source: Public Records
Mortgage History
| Date | Status | Borrower | Loan Amount |
|---|---|---|---|
| Open | Koester Donald | $64,000 |
Source: Public Records
Tax History Compared to Growth
Tax History
| Year | Tax Paid | Tax Assessment Tax Assessment Total Assessment is a certain percentage of the fair market value that is determined by local assessors to be the total taxable value of land and additions on the property. | Land | Improvement |
|---|---|---|---|---|
| 2025 | $2,123 | $68,400 | $0 | $0 |
| 2024 | $1,323 | $64,800 | $0 | $0 |
| 2023 | $1,256 | $59,900 | $0 | $0 |
| 2022 | $1,919 | $52,700 | $0 | $0 |
| 2021 | $1,866 | $49,600 | $0 | $0 |
| 2020 | $1,151 | $46,300 | $0 | $0 |
| 2019 | $1,678 | $36,700 | $0 | $0 |
| 2018 | $1,169 | $33,900 | $0 | $0 |
| 2017 | $1,602 | $29,400 | $5,300 | $24,100 |
| 2016 | $1,591 | $29,400 | $0 | $0 |
| 2015 | -- | $26,200 | $0 | $0 |
| 2014 | -- | $24,200 | $0 | $0 |
| 2011 | -- | $33,600 | $7,600 | $26,000 |
Source: Public Records
Map
Nearby Homes
- 19541 Colman St
- 19630 Webster St
- 19573 Heckman St
- 19578 Opal St
- 19565 Stafford St
- 19633 E 14 Mile Rd
- 34161 Beaconsfield St
- 20158 Williamson St
- 20219 Finley St
- 20118 Nicke St
- 19560 Spagnuolo Ln Unit 22
- 19793 Electra St
- 20415 Nicke St
- 20446 Williamson St
- 20440 Nicke St
- 19732 Voiland St
- 34559 Chope Place
- 18750 E 14 Mile Rd
- 18754 E 14 Mile Rd Unit 2
- 34606 Beaconsfield St
- 19550 Colman St
- 19558 Colman St
- 19542 Colman St
- 19566 Colman St
- 19534 Colman St
- 19574 Colman St
- 19526 Colman St
- 19557 Webster St
- 19565 Webster St
- 19582 Colman St
- 19518 Colman St
- 19573 Webster St
- 19549 Colman St
- 19557 Colman St
- 19565 Colman St
- 19533 Colman St
- 19581 Webster St
- 19590 Colman St
- 19573 Colman St
- 19525 Colman St