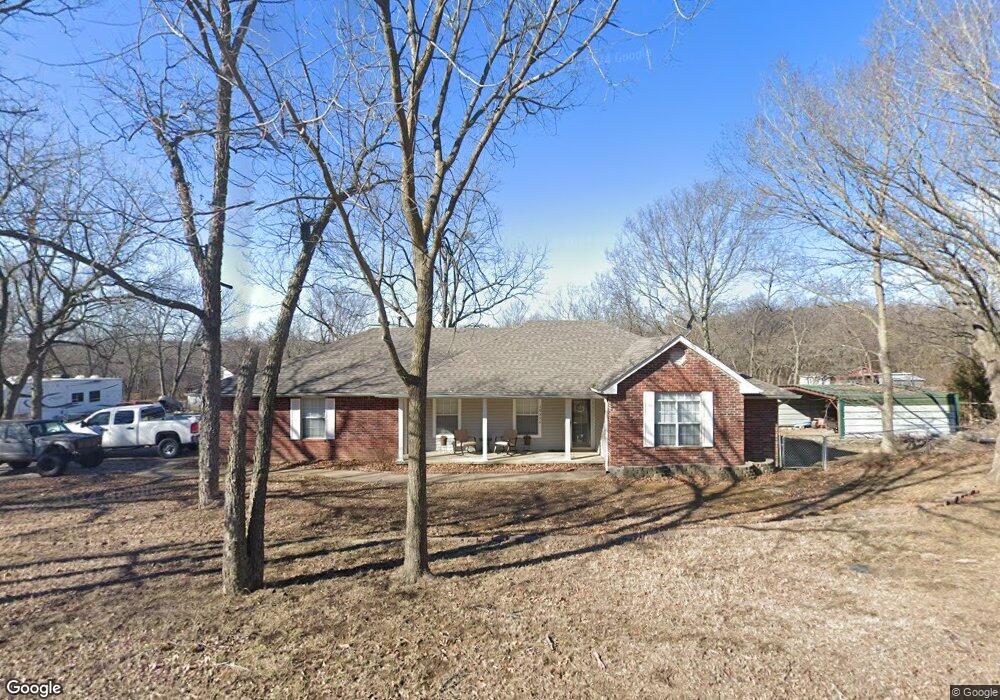
19550 Cottrell Dr Claremore, OK 74019
Estimated Value: $247,000 - $275,000
3
Beds
2
Baths
1,473
Sq Ft
$174/Sq Ft
Est. Value
About This Home
This home is located at 19550 Cottrell Dr, Claremore, OK 74019 and is currently estimated at $255,741, approximately $173 per square foot. 19550 Cottrell Dr is a home with nearby schools including Justus-Tiawah Public School.
Ownership History
Date
Name
Owned For
Owner Type
Purchase Details
Closed on
Apr 21, 2021
Sold by
Highfill Carson
Bought by
Sabin Jeremiah and Sabin Jennifer
Current Estimated Value
Home Financials for this Owner
Home Financials are based on the most recent Mortgage that was taken out on this home.
Original Mortgage
$185,576
Outstanding Balance
$167,461
Interest Rate
3.1%
Mortgage Type
FHA
Estimated Equity
$88,280
Purchase Details
Closed on
Sep 2, 2020
Sold by
Terry Cassie A and Terry Cassie A
Bought by
Highfill Carson
Purchase Details
Closed on
Nov 16, 2006
Sold by
Chancellor Larry J and Chancellor Lisa A
Bought by
Terry Shirley B and Terry Cassie A
Purchase Details
Closed on
Oct 16, 2000
Sold by
Alexander William D
Purchase Details
Closed on
Mar 30, 1999
Sold by
Stimson Terrance J
Create a Home Valuation Report for This Property
The Home Valuation Report is an in-depth analysis detailing your home's value as well as a comparison with similar homes in the area
Home Values in the Area
Average Home Value in this Area
Purchase History
| Date | Buyer | Sale Price | Title Company |
|---|---|---|---|
| Sabin Jeremiah | $189,000 | Apex Ttl & Closing Svcs Llc | |
| Highfill Carson | $147,186 | None Available | |
| Terry Shirley B | $100,000 | Anchor Title & Closing | |
| -- | $104,000 | -- | |
| -- | $97,500 | -- |
Source: Public Records
Mortgage History
| Date | Status | Borrower | Loan Amount |
|---|---|---|---|
| Open | Sabin Jeremiah | $185,576 |
Source: Public Records
Tax History Compared to Growth
Tax History
| Year | Tax Paid | Tax Assessment Tax Assessment Total Assessment is a certain percentage of the fair market value that is determined by local assessors to be the total taxable value of land and additions on the property. | Land | Improvement |
|---|---|---|---|---|
| 2025 | $2,047 | $22,056 | $5,017 | $17,039 |
| 2024 | $2,047 | $21,414 | $4,055 | $17,359 |
| 2023 | $2,047 | $20,790 | $3,516 | $17,274 |
| 2022 | $1,981 | $20,818 | $3,520 | $17,298 |
| 2021 | $1,557 | $18,778 | $3,300 | $15,478 |
| 2020 | $1,503 | $17,121 | $3,056 | $14,065 |
| 2019 | $1,532 | $17,120 | $3,179 | $13,941 |
| 2018 | $1,534 | $17,121 | $3,104 | $14,017 |
| 2017 | $1,456 | $17,121 | $3,128 | $13,993 |
| 2016 | $1,561 | $17,621 | $3,300 | $14,321 |
| 2015 | $1,449 | $17,121 | $3,300 | $13,821 |
| 2014 | $1,523 | $16,793 | $3,300 | $13,493 |
Source: Public Records
Map
Nearby Homes
- 009 E 480 Rd
- 008 E 480 Rd
- 007 E 480 Rd
- 0 S 4197 Rd
- 17065 Honeysuckle Ln
- 09 S 4200 Rd
- 03 S 4200 Rd
- 04 S 4200 Rd
- 05 S 4200 Rd
- 16053 E Pueblo Rd
- 18402 E 480 Rd
- 06 S 4200 Rd
- 19771 S Wind Ridge Dr
- 19985 S Wind Ridge Dr
- 19962 S Windridge Dr
- 18870 Timberlake
- 25 E 470 Rd
- 19075 E Timber Trail
- 21304 S 4200 Rd
- 18723 S 4185 Rd Unit A
- 19590 Cottrell Dr
- 19555 Cottrell Dr
- 19600 Cottrell Dr
- 19454 Cottrell Dr
- 19445 Cottrell Dr
- 19535 S 4200 Rd Unit A
- 19630 Cottrell Dr
- 19345 Cottrell Dr
- 19727 Cottrell Dr
- 19299 Cottrell Dr
- 19652 Cottrell Dr
- 19324 Cottrell Dr
- 19747 Cottrell Dr
- 19702 Cottrell Dr
- 19436 S 4200 Rd
- 17342 Savanna Ct
- 19272 Cottrell Dr
- 19555 S 4200 Rd
- 19412 Mountain Ln
- 19486 Mountain Ln