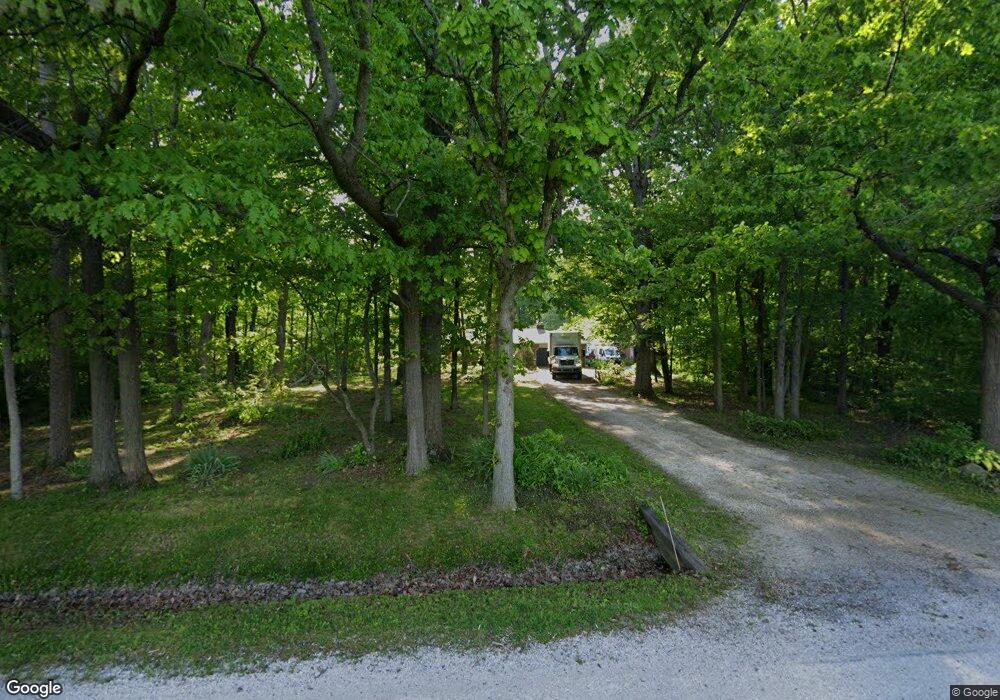
1956 N Stange Rd Graytown, OH 43432
Estimated Value: $270,000 - $322,000
3
Beds
2
Baths
1,380
Sq Ft
$214/Sq Ft
Est. Value
About This Home
This home is located at 1956 N Stange Rd, Graytown, OH 43432 and is currently estimated at $294,713, approximately $213 per square foot. 1956 N Stange Rd is a home located in Ottawa County with nearby schools including Oak Harbor High School.
Ownership History
Date
Name
Owned For
Owner Type
Purchase Details
Closed on
Aug 10, 2021
Sold by
West Paul A
Bought by
West Benjamin J
Current Estimated Value
Home Financials for this Owner
Home Financials are based on the most recent Mortgage that was taken out on this home.
Original Mortgage
$190,000
Interest Rate
2.9%
Mortgage Type
New Conventional
Purchase Details
Closed on
Aug 4, 2021
Sold by
West Paul A
Bought by
West Benjamin J
Home Financials for this Owner
Home Financials are based on the most recent Mortgage that was taken out on this home.
Original Mortgage
$190,000
Interest Rate
2.9%
Mortgage Type
New Conventional
Purchase Details
Closed on
Jun 8, 2021
Sold by
Allen West Richard
Bought by
Richard A West And Connie M West Living Trust and We Connie
Home Financials for this Owner
Home Financials are based on the most recent Mortgage that was taken out on this home.
Original Mortgage
$190,000
Interest Rate
3%
Mortgage Type
New Conventional
Purchase Details
Closed on
Nov 29, 1993
Sold by
West Richard and West Connie
Bought by
West Richard and West Connie
Create a Home Valuation Report for This Property
The Home Valuation Report is an in-depth analysis detailing your home's value as well as a comparison with similar homes in the area
Home Values in the Area
Average Home Value in this Area
Purchase History
| Date | Buyer | Sale Price | Title Company |
|---|---|---|---|
| West Benjamin J | $200,000 | Weis Kenton P | |
| West Benjamin J | $200,000 | None Listed On Document | |
| Richard A West And Connie M West Living Trust | -- | -- | |
| West Richard | -- | -- | |
| West Richard A | -- | -- |
Source: Public Records
Mortgage History
| Date | Status | Borrower | Loan Amount |
|---|---|---|---|
| Closed | West Benjamin J | $190,000 | |
| Closed | West Benjamin J | $190,000 |
Source: Public Records
Tax History Compared to Growth
Tax History
| Year | Tax Paid | Tax Assessment Tax Assessment Total Assessment is a certain percentage of the fair market value that is determined by local assessors to be the total taxable value of land and additions on the property. | Land | Improvement |
|---|---|---|---|---|
| 2024 | $2,939 | $80,010 | $27,055 | $52,955 |
| 2023 | $2,939 | $61,509 | $14,896 | $46,613 |
| 2022 | $2,547 | $61,509 | $14,896 | $46,613 |
| 2021 | $2,202 | $61,510 | $14,900 | $46,610 |
| 2020 | $1,905 | $52,890 | $13,300 | $39,590 |
| 2019 | $1,838 | $52,890 | $13,300 | $39,590 |
| 2018 | $1,688 | $52,890 | $13,300 | $39,590 |
| 2017 | $1,252 | $45,390 | $10,810 | $34,580 |
| 2016 | $1,255 | $45,390 | $10,810 | $34,580 |
| 2015 | $1,255 | $45,390 | $10,810 | $34,580 |
| 2014 | $626 | $43,570 | $10,810 | $32,760 |
| 2013 | $1,223 | $43,570 | $10,810 | $32,760 |
Source: Public Records
Map
Nearby Homes
- 16030 W Moline-Martin Rd
- 0 N Graytown Rd
- 14339 3rd St
- 14878 W State Route 163
- 1861 N Opfer-Lentz Rd
- 3262 Toussaint-Portage Rd
- 19383 Courtland Ave
- 0 W Portage River Rd S Unit 6130453
- 506 W Water St
- 516 N Church St
- 527 N Locust St
- 336 N Church St
- 214 N Church St
- 0 W Walbridge Rd
- Track 1 W Walbridge Rd
- 19367 W Walbridge Rd
- 7105 N Elliston Trowbridge Rd
- 130 E Water St
- 14328 W State Route 163
- 121 N Maple St
- 1982 N Stange Rd
- 1936 N Stange Rd
- 1977 N Stange Rd
- 1977 N Stange Rd
- 1977 N Stange Rd
- 1977 N Stange Rd Unit 115
- 2085 N Stange Rd
- 2119 N Stange Rd
- 2140 N Stange Rd
- 16156 W Toussaint North Rd
- 16090 W Toussaint North Rd
- 000 W Toussaint Rd N
- 15810 W Toussaint North Rd
- 15750 W Toussaint North Rd
- 16235 W True Rd
- 16410 W Toussaint North Rd
- 16178 W True Rd
- 15705 W Toussaint North Rd
- 1429 N Stange Rd
- 17455 W True Rd