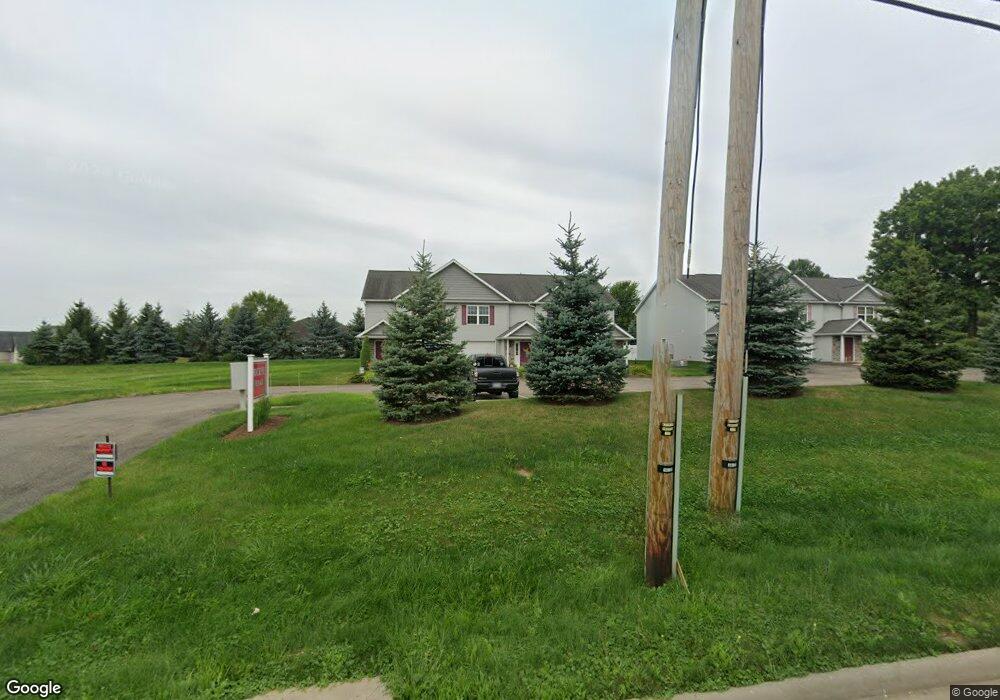
1956 University Commons Dr SE Unit 1956 Massillon, OH 44646
Southeast Massillon NeighborhoodEstimated Value: $253,958 - $265,000
3
Beds
2
Baths
1,759
Sq Ft
$147/Sq Ft
Est. Value
About This Home
This home is located at 1956 University Commons Dr SE Unit 1956, Massillon, OH 44646 and is currently estimated at $258,240, approximately $146 per square foot. 1956 University Commons Dr SE Unit 1956 is a home located in Stark County with nearby schools including Pfeiffer Intermediate School, Edison Middle School, and Perry High School.
Ownership History
Date
Name
Owned For
Owner Type
Purchase Details
Closed on
Jun 3, 2020
Sold by
Shank David P
Bought by
Rea Brenda J
Current Estimated Value
Purchase Details
Closed on
Jan 3, 2020
Sold by
Willhite Susan J
Bought by
Rea Brenda J
Purchase Details
Closed on
Sep 29, 2009
Sold by
Tobin Enterprises Inc
Bought by
Shank David P and Willhite Susan J
Home Financials for this Owner
Home Financials are based on the most recent Mortgage that was taken out on this home.
Original Mortgage
$65,000
Interest Rate
5.19%
Mortgage Type
New Conventional
Create a Home Valuation Report for This Property
The Home Valuation Report is an in-depth analysis detailing your home's value as well as a comparison with similar homes in the area
Home Values in the Area
Average Home Value in this Area
Purchase History
| Date | Buyer | Sale Price | Title Company |
|---|---|---|---|
| Rea Brenda J | $77,300 | None Available | |
| Rea Brenda J | -- | None Available | |
| Shank David P | -- | None Available | |
| Shank David P | $140,900 | Attorney |
Source: Public Records
Mortgage History
| Date | Status | Borrower | Loan Amount |
|---|---|---|---|
| Previous Owner | Shank David P | $65,000 |
Source: Public Records
Tax History Compared to Growth
Tax History
| Year | Tax Paid | Tax Assessment Tax Assessment Total Assessment is a certain percentage of the fair market value that is determined by local assessors to be the total taxable value of land and additions on the property. | Land | Improvement |
|---|---|---|---|---|
| 2025 | -- | $75,080 | $13,760 | $61,320 |
| 2024 | -- | $75,080 | $13,760 | $61,320 |
| 2023 | $2,777 | $63,140 | $13,230 | $49,910 |
| 2022 | $2,758 | $63,140 | $13,230 | $49,910 |
| 2021 | $2,962 | $63,140 | $13,230 | $49,910 |
| 2020 | $2,110 | $54,110 | $10,570 | $43,540 |
| 2019 | $1,864 | $54,110 | $10,570 | $43,540 |
| 2018 | $1,831 | $54,110 | $10,570 | $43,540 |
| 2017 | $1,625 | $46,840 | $10,890 | $35,950 |
| 2016 | $1,634 | $46,840 | $10,890 | $35,950 |
| 2015 | $1,650 | $46,840 | $10,890 | $35,950 |
| 2014 | $1,378 | $38,960 | $8,610 | $30,350 |
| 2013 | $695 | $38,960 | $8,610 | $30,350 |
Source: Public Records
Map
Nearby Homes
- 2132 University Commons Dr SE Unit 2132
- 2160 Championship Cir SE
- Lot #28 Championship Cir SE
- Lot #47 Championship Cir SE
- Lot #51 Championship Cir SE
- 1572 Championship Cir SE
- 1553 Championship Cir SE
- 2335 Southway St SW
- 2950 Southway St SW
- Lot 19 Candell St SE
- Lot# 3 Candell St SE
- Lot# 7 Candell St SE
- Lot# 10 Candell St SE
- Lot# 9 Candell St SE
- Lot# 2 Candell St SE
- Lot 24 Candell Ave SW
- Lot# 5 Candell St SE
- Lot# 14 Candell St SE
- Lot# 6 Candell St SE
- Lot# 17 Candell St SE
- 1946 University Commons Dr SE Unit 1946
- 1952 University Commons Dr SE Unit 1952
- 2026 University Commons Dr SE Unit 2026
- 1942 University Commons Dr SE
- 2022 University Commons Dr SE Unit 2022
- 2036 University Commons Dr SE Unit 2036
- 1926 University Commons Dr SE Unit 1926
- 2032 University Commons Dr SE Unit 2032
- 1922 University Commons Dr SE Unit 1922
- 1916 University Commons Dr SE Unit 1916
- 1912 University Commons Dr SE Unit 1912
- 2042 University Commons Dr SE Unit 2042
- 2046 University Commons Dr SE Unit 2046
- 1943 University Commons Dr SE Unit 1943
- 2052 University Commons Dr SE Unit 2052
- 1947 University Commons Dr SE
- 2056 University Commons Dr SE Unit 2056
- 2301 Richville Dr SW
- 1953 University Commons Dr SE Unit 1953
- 1957 University Commons Dr SE Unit 1957