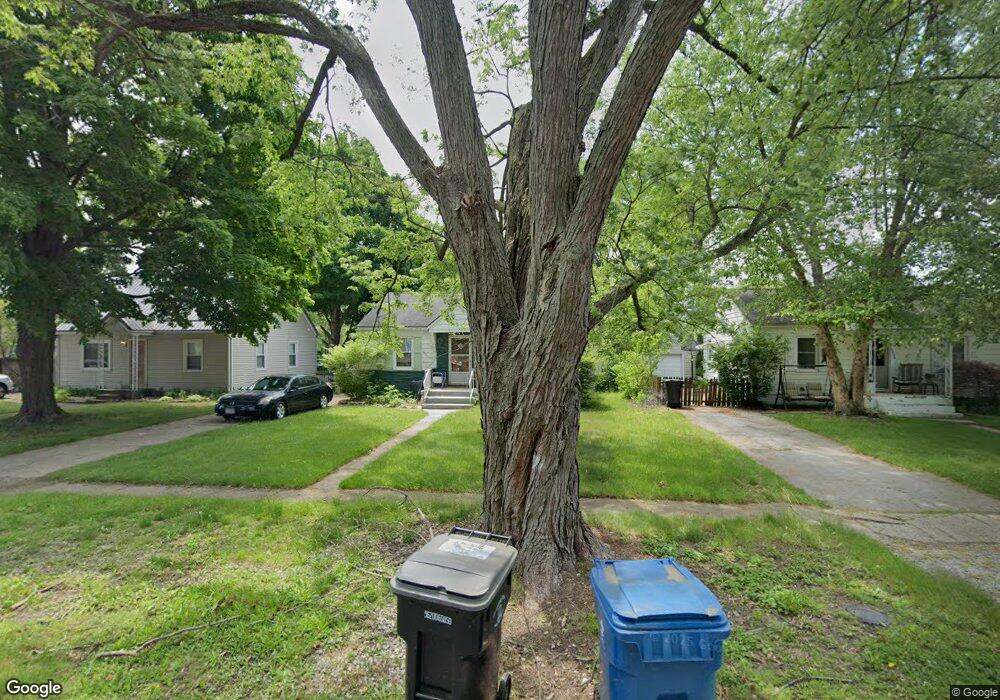
19562 Sherwood Ave South Bend, IN 46637
Estimated Value: $135,000 - $184,000
3
Beds
1
Bath
1,080
Sq Ft
$151/Sq Ft
Est. Value
About This Home
This home is located at 19562 Sherwood Ave, South Bend, IN 46637 and is currently estimated at $163,152, approximately $151 per square foot. 19562 Sherwood Ave is a home located in St. Joseph County with nearby schools including Clay Intermediate Center, Darden Elementary School, and Edison Middle School.
Ownership History
Date
Name
Owned For
Owner Type
Purchase Details
Closed on
Jul 22, 2021
Sold by
Anscar Conley Sr Arthur
Bought by
Conley Brian A
Current Estimated Value
Purchase Details
Closed on
May 7, 2021
Sold by
Andrew Tubicsak Eugene
Bought by
Leyba Ernest Timothy and Leyba Janet Louise
Purchase Details
Closed on
Feb 1, 2020
Sold by
Anscar Conley Brian
Bought by
Tubicsak Eugene Andrew
Purchase Details
Closed on
May 1, 2016
Sold by
Conley Brian
Bought by
Tubicsak Eugene Andrew
Purchase Details
Closed on
Dec 16, 2015
Sold by
Conley Brian
Bought by
Conley Brian
Purchase Details
Closed on
Jan 1, 2015
Sold by
Conley Brian
Bought by
Tubicsak Eugene Andrew
Purchase Details
Closed on
Apr 14, 2009
Sold by
Conley Francis G
Bought by
Conley Arthur A and Conley Shirley E
Purchase Details
Closed on
May 9, 2008
Sold by
Shirley Arthur A
Bought by
Conley Francis G
Purchase Details
Closed on
Apr 26, 2007
Sold by
Conley Arthur and Conley Shirley
Bought by
Conley Francis
Create a Home Valuation Report for This Property
The Home Valuation Report is an in-depth analysis detailing your home's value as well as a comparison with similar homes in the area
Home Values in the Area
Average Home Value in this Area
Purchase History
| Date | Buyer | Sale Price | Title Company |
|---|---|---|---|
| Conley Brian A | -- | -- | |
| Leyba Ernest Timothy | -- | None Listed On Document | |
| Tubicsak Eugene Andrew | $45,000 | None Listed On Document | |
| Tubicsak Eugene Andrew | $31,700 | -- | |
| Conley Brian | -- | -- | |
| Tubicsak Eugene Andrew | $45,000 | -- | |
| Conley Arthur A | -- | None Available | |
| Conley Francis G | -- | None Available | |
| Conley Francis | -- | None Available |
Source: Public Records
Tax History Compared to Growth
Tax History
| Year | Tax Paid | Tax Assessment Tax Assessment Total Assessment is a certain percentage of the fair market value that is determined by local assessors to be the total taxable value of land and additions on the property. | Land | Improvement |
|---|---|---|---|---|
| 2024 | $2,521 | $121,400 | $25,800 | $95,600 |
| 2023 | $913 | $109,300 | $25,800 | $83,500 |
| 2022 | $913 | $109,300 | $25,800 | $83,500 |
| 2021 | $873 | $94,200 | $13,200 | $81,000 |
| 2020 | $655 | $82,900 | $11,600 | $71,300 |
| 2019 | $521 | $78,500 | $11,000 | $67,500 |
| 2018 | $467 | $73,800 | $10,200 | $63,600 |
| 2017 | $461 | $72,000 | $10,200 | $61,800 |
| 2016 | $361 | $90,700 | $9,200 | $81,500 |
| 2014 | $2,161 | $85,700 | $7,800 | $77,900 |
Source: Public Records
Map
Nearby Homes
- 126 E Cripe St
- 51617 Prescott Ave
- 51700 Prescott Ave
- 51670 Prescott Ave
- 51650 Prescott Ave
- 19417 Darden Rd
- 52890 Indiana State Route 933 Unit 165
- 19253 Hamilton St
- 52244 Lily Rd
- 52303 Hollyhock Rd
- 52921 Marks St
- 53468 Old Woodbridge Ct Unit 5
- 53434 Old Woodbridge Ct Unit 2
- 53463 Old Woodbridge Ct Unit 6
- 409-417 N Dixie Way
- 20221 Darden Rd
- 52650 Hastings St
- 332 Weber St
- 324 Weber St
- 128 Rhode St
- 19574 Sherwood Ave
- 19552 Sherwood Ave
- 19584 Sherwood Ave
- 19542 Sherwood Ave
- 19573 Arlington Ave
- 19551 Arlington Ave
- 19530 Sherwood Ave
- 19596 Sherwood Ave
- 19561 Sherwood Ave
- 19551 Sherwood Ave
- 19573 Sherwood Ave
- 19593 Arlington Ave
- 19531 Sherwood Ave
- 19583 Sherwood Ave
- 19595 Sherwood Ave
- 19523 Arlington Ave
- 19607 Arlington Ave
- 52574 Myrtle Ave
- 52584 Myrtle Ave
- 19615 Sherwood Ave