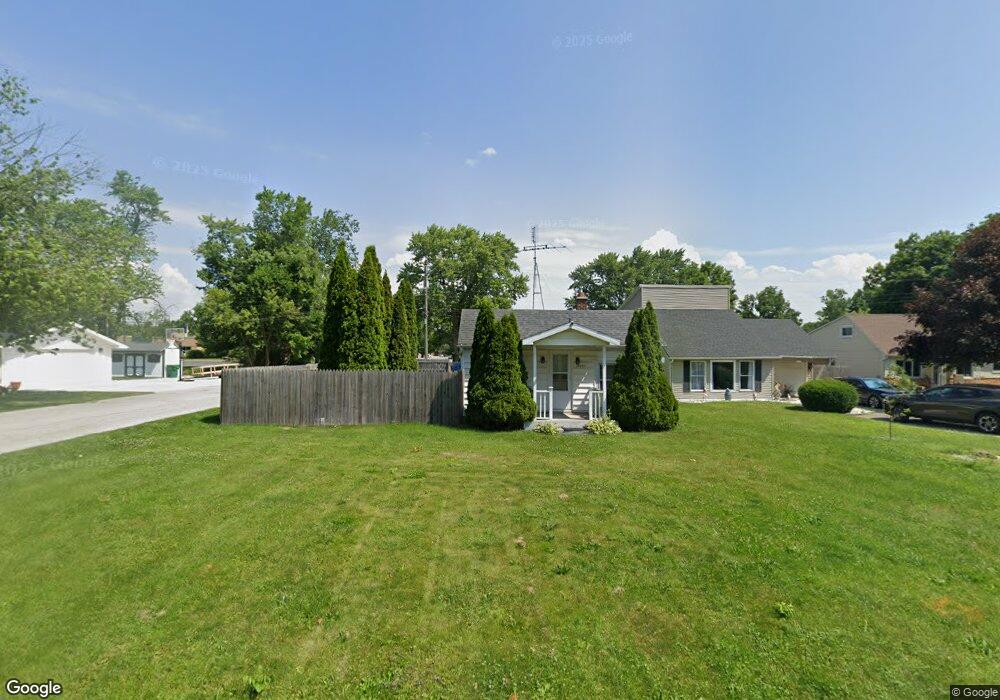
19563 Yoder St South Bend, IN 46614
Estimated Value: $81,000 - $123,000
1
Bed
1
Bath
732
Sq Ft
$141/Sq Ft
Est. Value
About This Home
This home is located at 19563 Yoder St, South Bend, IN 46614 and is currently estimated at $102,985, approximately $140 per square foot. 19563 Yoder St is a home located in St. Joseph County with nearby schools including Hay Elementary School, Marshall Traditional School, and Clay Intermediate Center.
Ownership History
Date
Name
Owned For
Owner Type
Purchase Details
Closed on
Dec 10, 2021
Sold by
Longbrake Luther H and Longbrake Jinny L
Bought by
Kropf Daniel L and Kropf Amy
Current Estimated Value
Home Financials for this Owner
Home Financials are based on the most recent Mortgage that was taken out on this home.
Original Mortgage
$56,949
Outstanding Balance
$52,292
Interest Rate
3.14%
Mortgage Type
FHA
Estimated Equity
$50,693
Purchase Details
Closed on
Aug 7, 2015
Sold by
Richardson Shirley K
Bought by
Longbrake Luther H and Longbrake Jinny L
Create a Home Valuation Report for This Property
The Home Valuation Report is an in-depth analysis detailing your home's value as well as a comparison with similar homes in the area
Home Values in the Area
Average Home Value in this Area
Purchase History
| Date | Buyer | Sale Price | Title Company |
|---|---|---|---|
| Kropf Daniel L | $58,000 | Metropolitan Title | |
| Longbrake Luther H | -- | Meridian Title |
Source: Public Records
Mortgage History
| Date | Status | Borrower | Loan Amount |
|---|---|---|---|
| Open | Kropf Daniel L | $56,949 |
Source: Public Records
Tax History Compared to Growth
Tax History
| Year | Tax Paid | Tax Assessment Tax Assessment Total Assessment is a certain percentage of the fair market value that is determined by local assessors to be the total taxable value of land and additions on the property. | Land | Improvement |
|---|---|---|---|---|
| 2024 | $551 | $83,200 | $22,700 | $60,500 |
| 2023 | $402 | $71,800 | $22,700 | $49,100 |
| 2022 | $416 | $71,000 | $22,700 | $48,300 |
| 2021 | $462 | $58,700 | $6,500 | $52,200 |
| 2020 | $1,219 | $48,800 | $5,400 | $43,400 |
| 2019 | $1,056 | $50,800 | $5,400 | $45,400 |
| 2018 | $806 | $34,200 | $3,600 | $30,600 |
| 2017 | $879 | $33,900 | $3,600 | $30,300 |
| 2016 | $891 | $33,900 | $3,600 | $30,300 |
| 2014 | -- | $33,400 | $4,000 | $29,400 |
| 2013 | -- | $33,400 | $4,000 | $29,400 |
Source: Public Records
Map
Nearby Homes
- 525 Yoder St Unit 49
- 520 Yoder St Unit 50
- 522 Dice St
- 19570 Dice St
- 519 E Johnson Rd
- 734 Dice St Unit 95
- 737 Dice Ct Unit 93
- 19711 Pasadena Ave
- 60091 Carroll St
- 19746 Detroit Ave
- 19694 Ruth Ave
- 20485 Jewell Ave
- 20440 Jewell Ave Unit 24
- 20454 Jewell Ave
- 19627 Southland Ave
- 0 Clara St
- 821 Eagle Cove Dr
- 5914 Miami St
- 1222 Berkshire Dr
- 5428 Raleigh Dr
- 19555 Yoder St
- 19547 Yoder St
- 19597 Yoder St
- 19533 Yoder St
- 19562 Yoder St
- 19601 Yoder St
- 19598 Yoder St
- 19548 Yoder St
- 19515 Yoder St
- 19610 Yoder St
- 19532 Yoder St
- 19626 Yoder St
- 19518 Yoder St
- 19577 Dice St
- 19567 Hildebrand St
- 19557 Hildebrand St
- 19561 Dice St
- 19507 Yoder St
- 19595 Dice St
- 19551 Hildebrand St