Estimated Value: $569,000 - $656,000
3
Beds
3
Baths
3,036
Sq Ft
$195/Sq Ft
Est. Value
About This Home
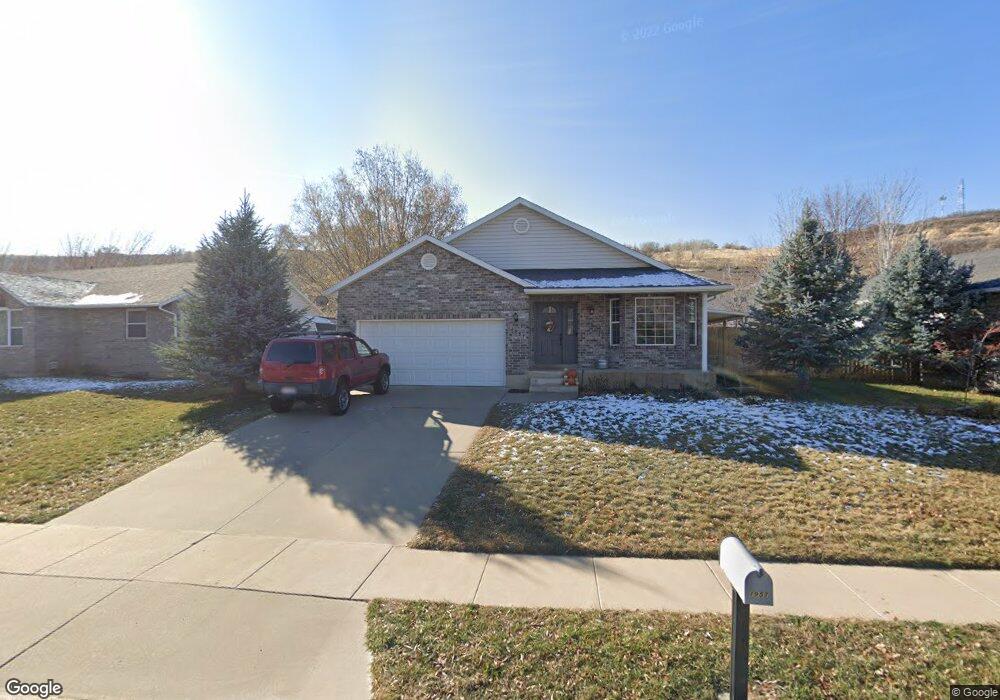
This home is located at 1957 Cedar Bench Dr, Ogden, UT 84405 and is currently estimated at $593,218, approximately $195 per square foot. 1957 Cedar Bench Dr is a home located in Davis County with nearby schools including South Weber Elementary School, Sunset Junior High School, and Northridge High School.
Ownership History
Date
Name
Owned For
Owner Type
Purchase Details
Closed on
Jul 13, 2021
Sold by
Jacobson Laura B
Bought by
Nielsen David and Nielsen Tara
Current Estimated Value
Home Financials for this Owner
Home Financials are based on the most recent Mortgage that was taken out on this home.
Original Mortgage
$456,000
Outstanding Balance
$412,851
Interest Rate
2.9%
Mortgage Type
New Conventional
Estimated Equity
$180,367
Purchase Details
Closed on
Jun 4, 2009
Sold by
Howe Richard E and Shelley Howe E
Bought by
Schroedter Leonhardt and Schroedter Sheila Taylor
Home Financials for this Owner
Home Financials are based on the most recent Mortgage that was taken out on this home.
Original Mortgage
$274,778
Interest Rate
4.78%
Mortgage Type
VA
Purchase Details
Closed on
Jun 28, 1996
Sold by
U S Development Inc
Bought by
Howe Richard E and Shelley Howe E
Create a Home Valuation Report for This Property
The Home Valuation Report is an in-depth analysis detailing your home's value as well as a comparison with similar homes in the area
Purchase History
| Date | Buyer | Sale Price | Title Company |
|---|---|---|---|
| Nielsen David | -- | Old Republic Natl Title | |
| Schroedter Leonhardt | -- | Mountain View Title | |
| Howe Richard E | -- | Bonneville Title Company Inc |
Source: Public Records
Mortgage History
| Date | Status | Borrower | Loan Amount |
|---|---|---|---|
| Open | Nielsen David | $456,000 | |
| Previous Owner | Schroedter Leonhardt | $274,778 |
Source: Public Records
Tax History
| Year | Tax Paid | Tax Assessment Tax Assessment Total Assessment is a certain percentage of the fair market value that is determined by local assessors to be the total taxable value of land and additions on the property. | Land | Improvement |
|---|---|---|---|---|
| 2025 | $3,304 | $300,850 | $121,840 | $179,010 |
| 2024 | $3,216 | $301,400 | $98,647 | $202,753 |
| 2023 | $3,112 | $532,000 | $160,098 | $371,902 |
| 2022 | $3,375 | $320,650 | $77,460 | $243,190 |
| 2021 | $2,835 | $408,000 | $116,493 | $291,507 |
| 2020 | $2,536 | $354,000 | $108,818 | $245,182 |
| 2019 | $2,492 | $342,000 | $106,250 | $235,750 |
| 2018 | $2,205 | $317,000 | $98,109 | $218,891 |
| 2016 | $1,977 | $151,305 | $40,029 | $111,276 |
| 2015 | $1,876 | $136,675 | $40,029 | $96,646 |
| 2014 | $1,524 | $113,169 | $46,010 | $67,159 |
| 2013 | -- | $111,639 | $40,294 | $71,345 |
Source: Public Records
Map
Nearby Homes
- 7915 S 2050 E
- 7886 S 2100 E
- 2357 E 8100 S
- 7841 Peachwood Dr
- 7478 1980 E
- 8149 S 2425 E
- 1873 E 7600 S
- 8271 S 2600 E
- 1977 E Redshoulder Dr
- 7212 S Harolds Way
- 7897 S 2700 E Unit 303
- 7897 S 2700 E Unit 305
- 2772 E 3575 N
- 3087 N 2250 E
- 3142 N 1675 E
- 1809 E Whitetail Dr
- 1458 E South Weber Dr
- 2765 E 7825 S
- 1577 E South Weber Dr Unit 3
- 3176 N 1450 E
- 1969 Cedar Bench Dr
- 8036 Cedar Ct
- 8010 Cedar Ct
- 8048 Cedar Ct
- 1952 Cedar Bench Dr
- 1960 Cedar Bench Dr
- 8060 Cedar Ct
- 1981 Cedar Bench Dr
- 1972 Cedar Bench Dr
- 1936 Cedar Bench Dr
- 1978 Cedar Bench Dr
- 1959 Deer Run Dr
- 8017 Cedar Ct
- 8039 Cedar Ct
- 1977 Deer Run Dr
- 8005 Cedar Ct
- 1987 Cedar Bench Dr
- 8066 Cedar Ct
- 7970 S 1925 E
- 1989 Deer Run Dr
Your Personal Tour Guide
Ask me questions while you tour the home.