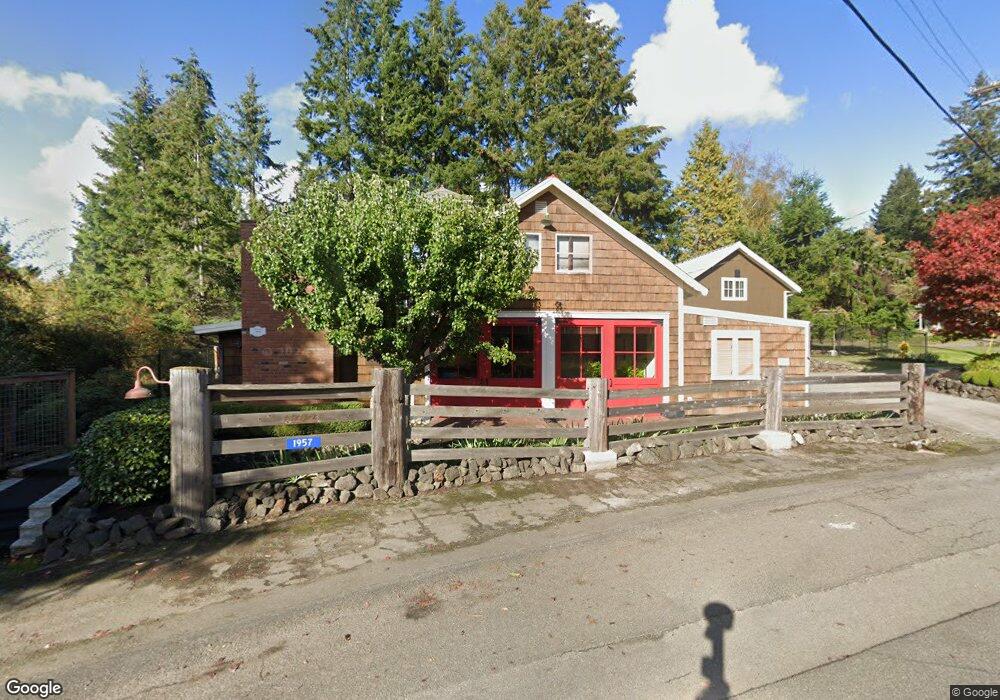
1957 Hilltop Dr NE Bainbridge Island, WA 98110
Estimated Value: $1,069,000 - $1,312,000
4
Beds
1
Bath
2,519
Sq Ft
$452/Sq Ft
Est. Value
About This Home
This home is located at 1957 Hilltop Dr NE, Bainbridge Island, WA 98110 and is currently estimated at $1,138,829, approximately $452 per square foot. 1957 Hilltop Dr NE is a home located in Kitsap County with nearby schools including Bainbridge High School, Carden Country School, and Hyla School.
Ownership History
Date
Name
Owned For
Owner Type
Purchase Details
Closed on
Feb 7, 2020
Sold by
Bartel Arthur G and Bartel Suzane M
Bought by
Bartel Arthur G and Bartel Suzane M
Current Estimated Value
Purchase Details
Closed on
Jul 10, 2003
Sold by
Brooks Caroline A and Flohr Caroline A
Bought by
Bartel Arthur G and Bartel Suzane M
Home Financials for this Owner
Home Financials are based on the most recent Mortgage that was taken out on this home.
Original Mortgage
$278,000
Outstanding Balance
$117,835
Interest Rate
5.22%
Mortgage Type
Purchase Money Mortgage
Estimated Equity
$1,020,994
Purchase Details
Closed on
May 12, 1999
Sold by
Jacobsen Mark and Jacobsen Fenton D
Bought by
Flohr Caroline A
Home Financials for this Owner
Home Financials are based on the most recent Mortgage that was taken out on this home.
Original Mortgage
$138,750
Interest Rate
6.94%
Create a Home Valuation Report for This Property
The Home Valuation Report is an in-depth analysis detailing your home's value as well as a comparison with similar homes in the area
Home Values in the Area
Average Home Value in this Area
Purchase History
| Date | Buyer | Sale Price | Title Company |
|---|---|---|---|
| Bartel Arthur G | -- | None Available | |
| Bartel Arthur G | $347,500 | Pacific Nw Title | |
| Flohr Caroline A | $185,000 | Pacific Nw Title |
Source: Public Records
Mortgage History
| Date | Status | Borrower | Loan Amount |
|---|---|---|---|
| Open | Bartel Arthur G | $278,000 | |
| Previous Owner | Flohr Caroline A | $138,750 |
Source: Public Records
Tax History Compared to Growth
Tax History
| Year | Tax Paid | Tax Assessment Tax Assessment Total Assessment is a certain percentage of the fair market value that is determined by local assessors to be the total taxable value of land and additions on the property. | Land | Improvement |
|---|---|---|---|---|
| 2026 | $6,545 | $799,720 | $228,500 | $571,220 |
| 2025 | $6,545 | $799,720 | $228,500 | $571,220 |
| 2024 | $6,256 | $799,720 | $228,500 | $571,220 |
| 2023 | $6,522 | $799,720 | $228,500 | $571,220 |
| 2022 | $5,997 | $626,220 | $174,220 | $452,000 |
| 2021 | $5,517 | $548,330 | $151,360 | $396,970 |
| 2020 | $5,591 | $548,330 | $151,360 | $396,970 |
| 2019 | $5,227 | $522,170 | $142,400 | $379,770 |
| 2018 | $5,147 | $403,380 | $107,880 | $295,500 |
| 2017 | $4,271 | $403,380 | $107,880 | $295,500 |
| 2016 | $3,971 | $356,280 | $123,540 | $232,740 |
| 2015 | $3,234 | $293,650 | $107,880 | $185,770 |
| 2014 | -- | $293,650 | $107,880 | $185,770 |
| 2013 | -- | $293,650 | $107,880 | $185,770 |
Source: Public Records
Map
Nearby Homes
- 0 Lot 9 Park View Dr NE
- 0 Devenny Ave NE Unit NWM2324546
- 2372 Douglas Dr NE
- 1574 Park View Dr NE Unit 1
- 0 Mardell (Lot 12) Ct Unit NWM1856638
- 0 Mardell (Lot 11) Ct Unit NWM1856637
- 0 Mardell (Lot 6) Ct Unit NWM1768026
- 0 Mardell (Lot 7) Ct Unit 1759157
- 9551 NE South Beach Dr Unit 3G
- 9889 NE South Beach Dr
- 9721 NE Charisma Cir
- 11121 NE Brownell Ln
- 1850 Beans Bight Rd NE
- 6069 Watauga Beach Dr E
- 8609 E Caraway Rd
- 8623 E Caraway Rd
- 4290 Rockaway Beach Rd NE
- 8471 E Caraway Rd
- 4740 NE Rose Ave NE
- 4420 Bluff Ln NE
- 2003 Belfair Ave NE
- 1948 Parkview Dr NE
- 2017 Belfair Ave NE
- 9710 NE Hilltop Dr
- 9710 Hilltop Dr NE
- 2006 Belfair Ave NE
- 2011 Soundview Dr NE
- 1912 NE Park View Dr
- 2030 Belfair Ave NE
- 2025 Belfair Ave NE
- 1941 Parkview Dr NE
- 0 Belfair Ave NE Unit 768041
- 0 Belfair Ave NE Unit 767833
- 0 Belfair Ave NE Unit 29014068
- 1807 Virginia Ct NE
- 9718 NE Hilltop Dr
- 0 Douglas Dr NE
- 0 Hilltop Dr NE
- 1882 Parkview Dr NE
- 2033 Soundview Dr NE