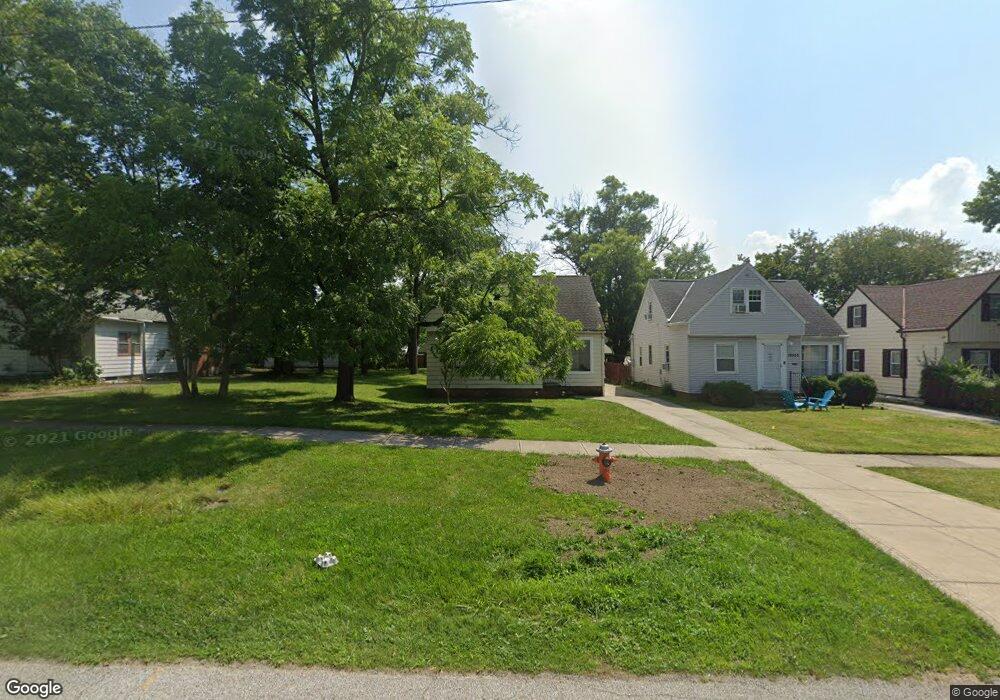
19570 Mccracken Rd Maple Heights, OH 44137
Estimated Value: $100,000 - $134,000
3
Beds
1
Bath
1,261
Sq Ft
$94/Sq Ft
Est. Value
About This Home
This home is located at 19570 Mccracken Rd, Maple Heights, OH 44137 and is currently estimated at $118,333, approximately $93 per square foot. 19570 Mccracken Rd is a home located in Cuyahoga County with nearby schools including Abraham Lincoln Elementary School, Rockside/ J.F. Kennedy School, and Barack Obama School.
Ownership History
Date
Name
Owned For
Owner Type
Purchase Details
Closed on
Mar 10, 2021
Sold by
Cuyahoga Development Group
Bought by
L & L Flynn Properties Llc
Current Estimated Value
Home Financials for this Owner
Home Financials are based on the most recent Mortgage that was taken out on this home.
Original Mortgage
$1,102,020
Interest Rate
3.69%
Mortgage Type
New Conventional
Purchase Details
Closed on
Jun 5, 2017
Sold by
Johnson Ernest and Wells Fargo Bank Na
Bought by
Cuyahoga Development Group Llc
Purchase Details
Closed on
Jun 30, 1989
Sold by
Sackett Gladys E
Bought by
Johnson Ernest L
Purchase Details
Closed on
Jan 1, 1975
Bought by
Sackett Gladys E
Create a Home Valuation Report for This Property
The Home Valuation Report is an in-depth analysis detailing your home's value as well as a comparison with similar homes in the area
Home Values in the Area
Average Home Value in this Area
Purchase History
| Date | Buyer | Sale Price | Title Company |
|---|---|---|---|
| L & L Flynn Properties Llc | $1,515,890 | Chicago Title | |
| Cuyahoga Development Group Llc | $20,100 | None Available | |
| Johnson Ernest L | $46,500 | -- | |
| Sackett Gladys E | -- | -- |
Source: Public Records
Mortgage History
| Date | Status | Borrower | Loan Amount |
|---|---|---|---|
| Previous Owner | L & L Flynn Properties Llc | $1,102,020 |
Source: Public Records
Tax History
| Year | Tax Paid | Tax Assessment Tax Assessment Total Assessment is a certain percentage of the fair market value that is determined by local assessors to be the total taxable value of land and additions on the property. | Land | Improvement |
|---|---|---|---|---|
| 2025 | $2,429 | $28,350 | $6,790 | $21,560 |
| 2024 | $2,692 | $28,350 | $6,790 | $21,560 |
| 2023 | $2,143 | $19,190 | $3,890 | $15,300 |
| 2022 | $2,136 | $19,180 | $3,885 | $15,295 |
| 2021 | $2,275 | $19,180 | $3,890 | $15,300 |
| 2020 | $1,949 | $14,530 | $2,940 | $11,590 |
| 2019 | $2,544 | $41,500 | $8,400 | $33,100 |
| 2018 | $2,099 | $14,530 | $2,940 | $11,590 |
| 2017 | $1,803 | $13,440 | $2,730 | $10,710 |
| 2016 | $1,745 | $13,440 | $2,730 | $10,710 |
| 2015 | $1,737 | $13,440 | $2,730 | $10,710 |
| 2014 | $1,737 | $14,770 | $3,010 | $11,760 |
Source: Public Records
Map
Nearby Homes
- 19703 Fairway Ave
- 19931 Raymond St
- 19105 Preston Rd
- 19812 Marvin Rd
- 19411 Marvin Rd
- 18909 Preston Rd
- 18915 Longview Ave
- 18990 Raymond St
- 18851 Raymond St
- 18840 Nitra Ave
- 5194 Homewood Ave
- 5147 Warrensville Center Rd
- 20715 Watson Rd
- 20111 Mountville Dr
- 19910 Mountville Dr
- 18408 Raymond St
- 5127 Erwin St
- 20919 Hansen Rd
- 20503 Mountville Dr
- 5100 Erwin St
- 19550 Mccracken Rd
- 19616 Mccracken Rd
- 19530 Mccracken Rd
- 19630 Mccracken Rd
- 19500 Mccracken Rd
- 19513 Fairway Ave
- 19517 Fairway Ave
- 19509 Fairway Ave
- 19601 Fairway Ave
- 19650 Mccracken Rd
- 19505 Fairway Ave
- 19490 Mccracken Rd
- 19501 Fairway Ave
- 19670 Mccracken Rd
- 19470 Mccracken Rd
- 19609 Fairway Ave
- 19417 Fairway Ave
- 19690 Mccracken Rd
- 19450 Mccracken Rd
- 19613 Fairway Ave
Your Personal Tour Guide
Ask me questions while you tour the home.