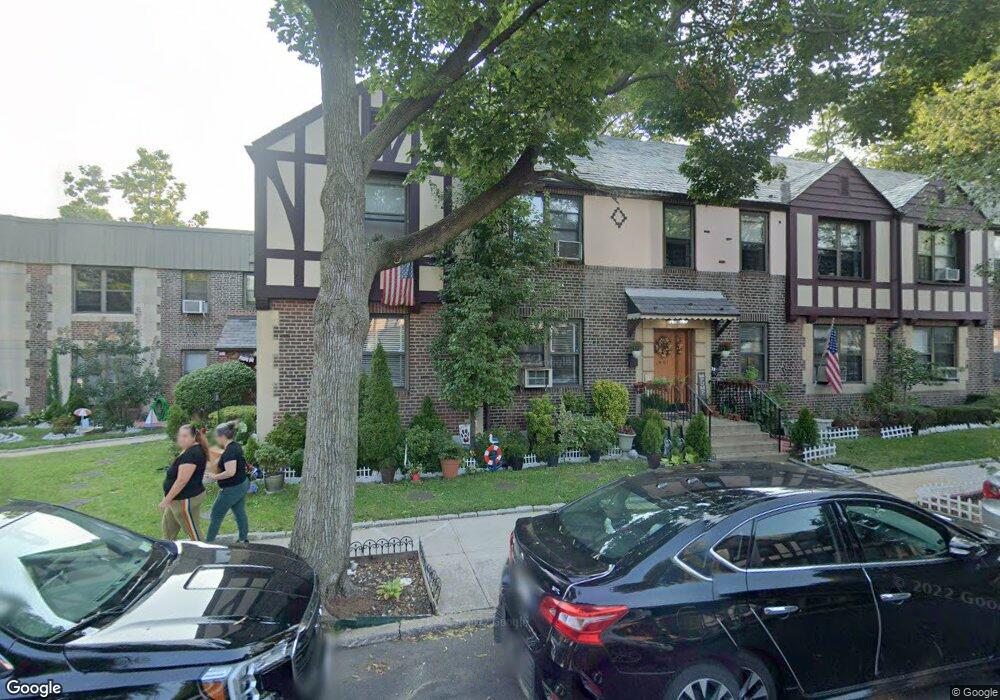
1959 79th St Unit 2 East Elmhurst, NY 11370
Ditmars Steinway NeighborhoodEstimated Value: $375,000 - $449,000
--
Bed
--
Bath
679
Sq Ft
$595/Sq Ft
Est. Value
About This Home
This home is located at 1959 79th St Unit 2, East Elmhurst, NY 11370 and is currently estimated at $404,177, approximately $595 per square foot. 1959 79th St Unit 2 is a home located in Queens County with nearby schools including P.S. 2 Alfred Zimberg, Is 141 The Steinway, and William Cullen Bryant High School.
Ownership History
Date
Name
Owned For
Owner Type
Purchase Details
Closed on
Mar 13, 2021
Sold by
Partsinevelos Phyllis and Partsinevelos Styliani
Bought by
Partsinevelos Sofia and Partsinevelos Styliani
Current Estimated Value
Home Financials for this Owner
Home Financials are based on the most recent Mortgage that was taken out on this home.
Original Mortgage
$211,000
Outstanding Balance
$189,466
Interest Rate
2.8%
Mortgage Type
Purchase Money Mortgage
Estimated Equity
$214,711
Purchase Details
Closed on
Feb 13, 2004
Sold by
Aurecchione Susan and Aureccione Anastasia
Bought by
Partsinevelos Phyllis and Partsinevelos Styliani
Home Financials for this Owner
Home Financials are based on the most recent Mortgage that was taken out on this home.
Original Mortgage
$160,000
Interest Rate
5.4%
Mortgage Type
Purchase Money Mortgage
Purchase Details
Closed on
Aug 15, 1994
Sold by
Kane Robert A and Wendt Therese D
Bought by
Aurecchione Anastasia and Aurecchione Susan
Create a Home Valuation Report for This Property
The Home Valuation Report is an in-depth analysis detailing your home's value as well as a comparison with similar homes in the area
Home Values in the Area
Average Home Value in this Area
Purchase History
| Date | Buyer | Sale Price | Title Company |
|---|---|---|---|
| Partsinevelos Sofia | -- | -- | |
| Partsinevelos Phyllis | $200,000 | -- | |
| Aurecchione Anastasia | $64,000 | American Title Insurance Co |
Source: Public Records
Mortgage History
| Date | Status | Borrower | Loan Amount |
|---|---|---|---|
| Open | Partsinevelos Sofia | $211,000 | |
| Previous Owner | Partsinevelos Phyllis | $160,000 |
Source: Public Records
Tax History Compared to Growth
Tax History
| Year | Tax Paid | Tax Assessment Tax Assessment Total Assessment is a certain percentage of the fair market value that is determined by local assessors to be the total taxable value of land and additions on the property. | Land | Improvement |
|---|---|---|---|---|
| 2025 | $3,878 | $30,952 | $6,667 | $24,285 |
| 2024 | $2,788 | $31,020 | $6,667 | $24,353 |
| 2023 | $3,875 | $30,999 | $6,667 | $24,332 |
| 2022 | $3,773 | $30,837 | $6,667 | $24,170 |
| 2021 | $3,526 | $28,742 | $6,667 | $22,075 |
| 2020 | $2,582 | $32,593 | $6,667 | $25,926 |
| 2019 | $2,399 | $31,960 | $6,667 | $25,293 |
| 2018 | $3,047 | $23,953 | $6,667 | $17,286 |
| 2017 | $2,712 | $21,323 | $6,667 | $14,656 |
| 2016 | $2,506 | $21,323 | $6,667 | $14,656 |
| 2015 | $1,426 | $18,479 | $6,667 | $11,812 |
| 2014 | $1,426 | $17,455 | $6,667 | $10,788 |
Source: Public Records
Map
Nearby Homes
- 19-65 79th St Unit 2C
- 1950 80th St Unit 1
- 19-50 80th St Unit 1
- 19-49 80th St
- 19-44 78th St
- 21-14 80th St
- 1956 81st St
- 21-16 77 Street 2nd Floor
- 7916 19th Rd Unit 2
- 80-18 19th Ave Unit 1
- 21-40 78th St Unit 2
- 21-43 80th St
- 2205 80th St
- 76-12 Ditmars Blvd Unit B3
- 2220 78th St Unit A3
- 22-39 78 St
- 2209 76th St Unit C2
- 22-27 76 St Unit B2
- 2208 76th St Unit A3
- 22-28 77th St Unit C1
- 1959 79th St Unit 1
- 1961 79th St Unit 2
- 1961 79th St Unit 1
- 19-61 79th St Unit 1
- 19-61 79th St Unit 2
- 1957 79th St Unit 2
- 1957 79th St Unit 1
- 19-63 79th St Unit D1
- 1963 79th St Unit 2
- 1963 79th St Unit 1
- 19-63 79th St Unit 1
- 19-37-37 79th St
- 19-67 79th St Unit 1B
- 19-53 79th St Unit 1-FL
- 1953 79th St Unit 2
- 1953 79th St Unit 1
- 19-53 79th St Unit 2
- 1965 79th St Unit 2
- 1965 79th St Unit 1
- 1967 79th St Unit 2