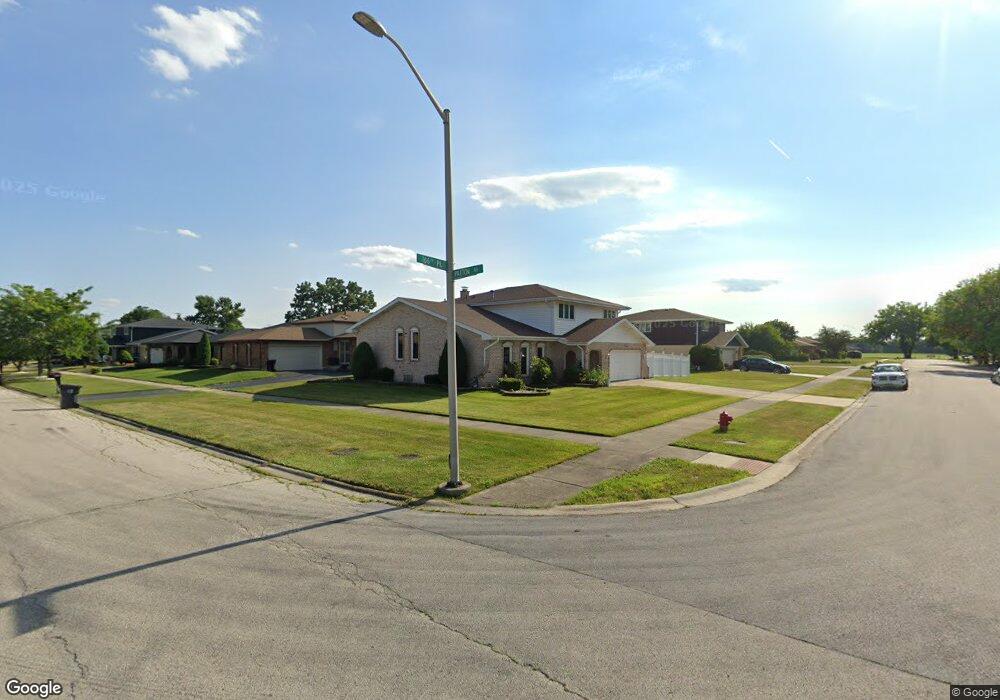
1959 E 166th Place South Holland, IL 60473
Estimated Value: $305,000 - $350,000
5
Beds
3
Baths
2,544
Sq Ft
$128/Sq Ft
Est. Value
About This Home
This home is located at 1959 E 166th Place, South Holland, IL 60473 and is currently estimated at $326,816, approximately $128 per square foot. 1959 E 166th Place is a home located in Cook County with nearby schools including Greenwood Elementary School, Mckinley Elementary School, and Mckinley Jr High School.
Ownership History
Date
Name
Owned For
Owner Type
Purchase Details
Closed on
Oct 27, 2017
Sold by
Chicago Title Land Trust Co
Bought by
Richey Yolanda
Current Estimated Value
Home Financials for this Owner
Home Financials are based on the most recent Mortgage that was taken out on this home.
Original Mortgage
$182,631
Outstanding Balance
$154,624
Interest Rate
4.25%
Mortgage Type
FHA
Estimated Equity
$172,192
Purchase Details
Closed on
Apr 11, 2013
Sold by
Chicago Title Land Trust Co
Bought by
Bowie Doris
Purchase Details
Closed on
Mar 20, 2013
Sold by
Bowie Doris
Bought by
Chicago Title Land Trust Co and Trut Number 12484
Purchase Details
Closed on
Jul 15, 2008
Sold by
Bowie Doris
Bought by
North Star Trust Co and Mb Financial Bank
Purchase Details
Closed on
May 19, 2008
Sold by
North Star Trust Co
Bought by
Bowie Doris
Purchase Details
Closed on
Jul 25, 2003
Sold by
Bowie Doris
Bought by
Mb Financial Bank Na and Trust #12484
Create a Home Valuation Report for This Property
The Home Valuation Report is an in-depth analysis detailing your home's value as well as a comparison with similar homes in the area
Home Values in the Area
Average Home Value in this Area
Purchase History
| Date | Buyer | Sale Price | Title Company |
|---|---|---|---|
| Richey Yolanda | $186,000 | Barrister Title | |
| Bowie Doris | -- | None Available | |
| Chicago Title Land Trust Co | -- | None Available | |
| North Star Trust Co | -- | None Available | |
| Bowie Doris | -- | None Available | |
| Mb Financial Bank Na | -- | -- |
Source: Public Records
Mortgage History
| Date | Status | Borrower | Loan Amount |
|---|---|---|---|
| Open | Richey Yolanda | $182,631 |
Source: Public Records
Tax History Compared to Growth
Tax History
| Year | Tax Paid | Tax Assessment Tax Assessment Total Assessment is a certain percentage of the fair market value that is determined by local assessors to be the total taxable value of land and additions on the property. | Land | Improvement |
|---|---|---|---|---|
| 2024 | $10,167 | $24,416 | $4,166 | $20,250 |
| 2023 | $9,876 | $26,000 | $4,166 | $21,834 |
| 2022 | $9,876 | $19,416 | $3,598 | $15,818 |
| 2021 | $9,524 | $19,415 | $3,598 | $15,817 |
| 2020 | $9,081 | $19,415 | $3,598 | $15,817 |
| 2019 | $8,846 | $18,955 | $3,030 | $15,925 |
| 2018 | $10,331 | $18,955 | $3,030 | $15,925 |
| 2017 | $9,154 | $20,604 | $3,030 | $17,574 |
| 2016 | $7,085 | $16,196 | $2,840 | $13,356 |
| 2015 | $7,720 | $18,048 | $2,840 | $15,208 |
| 2014 | $8,811 | $18,048 | $2,840 | $15,208 |
| 2013 | $8,240 | $18,308 | $2,840 | $15,468 |
Source: Public Records
Map
Nearby Homes
- 16747 Paxton Ave
- 16822 Merrill Ave
- 16909 Paxton Ave
- 500 Park Ave Unit 433
- 500 Park Ave Unit 238
- 500 Park Ave Unit 537
- 500 Park Ave Unit 236
- 400 Park Ave Unit 118
- 400 Park Ave Unit 411
- 400 Park Ave Unit 100
- 400 Park Ave Unit 211
- 1970 E 170th St
- 300 Park Ave Unit 639
- 2024 E 171st Ct
- 100 Park Ave
- 17048 Clyde Ave
- 200 Park Ave Unit 527
- 200 Park Ave Unit 725
- 200 Park Ave Unit 734
- 200 Park Ave Unit 428
- 16660 Paxton Ave
- 1943 E 166th Place
- 16661 Merrill Ave
- 1954 E 166th Place
- 16700 Paxton Ave
- 16701 Merrill Ave
- 1946 E 166th Place
- 16639 Paxton Ave
- 16633 Paxton Ave
- 16706 Paxton Ave
- 16645 Paxton Ave
- 16613 Paxton Ave
- 16707 Merrill Ave
- 1940 E 166th Place
- 16653 Paxton Ave
- 16654 Merrill Ave
- 16660 Merrill Ave
- 16607 Paxton Ave
- 1934 E 166th Place
- 16712 Paxton Ave